In the information age, in which the data economy is rapidly gaining importance, it is mission-critical to know how to quickly and efficiently retrieve trustworthy, high-quality, up-to-date information from reliable sources. This blog provides some ideas how to cope with this challenge. At the end of the blog you will find a list of reliable and valuable information sources, which I have been using in the past and therefore can witness that they are reliable and valuable.
Some years ago, one of my former staff members taught me the quite important insight that „knowledge primarily gains its meaning in a context“. Example: It’s certainly useful to know, how to drive a car, however, if you’re stranded on a desert island, this knowledge won’t help you. Instead, it would be better to know how to make a fire or how to open a coconut. So, context matters.
Context matters as well from a different perspective: As the following chart published on Reddit unter the headline „Top 4 countries with highest CO2 emissions per capita are Middle-Eastern“ illustrates, Qatar is supposed to be the country with the by far highest CO2 emissions per capita on planet Earth, followed by Kuwait and the United Arab Emirates (UAE):

Environmentally sensitive people, who have never been to the Middle-East, could react emotionally to this information and be outraged at why Qatari people are so irresponsible about our environment.
The impact of this information suddenly changes when per capita emissions are put in relation to the size of the population. As of 2018, Qatar has only 2.72 million inhabitants (less than Berlin), Kuwait only 4.57 million (less that Madrid) and the United Arab Emirates only 10.43 million (less than Paris), while countries like China or India each have around 1.4 billion (= 1,400 million) inhabitants. Besides, Qatar, Kuwait and the United Arab Emirates are all three major oil&gas producers and the extraction, refinery, transformation of oil&gas unfortunately generates a lot of CO2. Finally, the climate in the Middle-East is comparably hot, which means that virtually all buildings in the three countries are equipped with air conditioning systems that consume a lot of electricity, which in turn drives up CO2 emissions.
Conclusion: When interpreting per capita statistics, the number of related heads must always be taken into account in order to come to a meaningful interpretation.
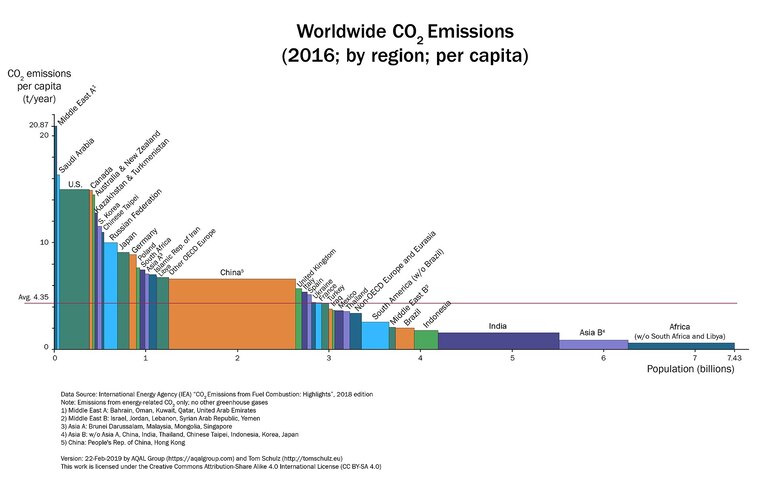
In the following chart based on 2016 data, the population size of the world’s countries and regions is plotted on the x-axis and the per capita CO2 emissions of these countries and regions are plotted on the y-axis. One can see at first glance that China, the USA and India are by far the largest CO2 emitters on our planet, which results from their size of population and their per capita CO2 emissions, while all states of the Middle-East together form a narrow line at the left edge of the chart:
A second informative graph shows the global CO2 emissions of states and regions in 2018 including the development since 1990. It’s taken from an article published by the German Frankfurter Allgemeine Zeitung (FAZ) on December 7, 2019, under the headline „World Climate Conference: The scramble for emission rights“ (see: https://t1p.de/jue0):

Lessons learned: Higher per capita emissions of states with just a few million inhabitants are a much smaller problem than lower CO2 emissions of states whose population is hundreds of millions or even more than a billion and whose economy is also growing dynamically – this applies for most developing and emerging countries, particularly China, India and the 54 African countries.
Key takeaway: When looking at a piece of information, do yourself a favor and always try to understand the „big picture“ and the context of this information. If you don’t do this, you make yourself an easy victim of miserable creatures, who try to manipulate you.
Before we go any further, we should understand, how to distinguish between the terms „data“, „information“, „knowledge“, „insight“ and „wisdom“. The following chart and citation is taken from an article published on June 20, 2019, under the headline „Data to Wisdom via Information, Knowledge & Insight„:

Citation: „Data has been grabbing a lot of headlines in recent years fueled, perhaps, by the exponential growth in its availability & relative ease in getting access to it. “Data is the new oil” say some, others proclaim “In data we trust” and many more speak constantly of ‘big data’ as if, on its own, it has the power to solve the key issues of the day. But, is it really the answer?
In its raw state data is not so useful & has no particular significance. It’s what you do with it, how you harness its potential and extract its benefits, that really counts. And that’s what gets us excited.
Discussions about data often focus on how to take it from its raw, unrefined state to wisdom and there’s various models used to describe this process. However, the one we like best is a simple five stage box (see above). The diagram neatly illustrates how it’s not data per se which has value but what you do with it.
- In the diagram above „Data“ is represented by a series of random dots that could mean something – or nothing. Data is e.g. raw numbers, words, etc. which lack context or meaning.
- Next is „Information“, which is where meaning or relationship is applied to the raw data. This is indicated by applying different colors to the dots.
- „Knowledge“ is gained when we are able to memorize the information, for i.e. standard multiplication tables or sunrise & sunset times in a given month. As we gain knowledge we begin to make sense of things and draw connections between different pieces of information.
- However, it’s at the „Insight“ level where data becomes seriously useful. Insight is the ability to synthesize knowledge in order obtain a deep understanding of a problem.
- With insight comes the prospect of „Wisdom“ – the ability to use insight to facilitate informed decision making.
In a business sense we view wisdom as the ability to transform data into action. But not action for action’s sake. It has to build on information, knowledge & insight to ensure a positive return on investment.“
<end of citation>
In the following I will use the term „information“ synonymously for data or knowledge (even if this is not 100% correct).
So, let’s dig deeper into the topic of how to retrieve, validate and organize information most effectively. One big challenge is the freshness and timeliness of information. Certain kind of information becomes quickly outdated, think of e.g. statistics on economic or societal events or developments. The vernacular says: „Nothing is as old as yesterday’s newspaper“ (except perhaps the tweet from the morning on Twitter).
Not least for this reason, in the information age, in which the data economy is rapidly gaining importance, it is mission-critical to know how to quickly and efficiently retrieve trustworthy, high-quality, up-to-date information from reliable sources.
According to the WeAreSocial report „Digital 2019“ (https://t1p.de/952j) the global coverage of internet and mobile phones looks like follows (in relation to a global population of 7.676 billion):
- There are 5.11 billion unique mobile users in the world today, up 100 million (2 percent) in 2018.
- There are 4.39 billion internet users in 2019, an increase of 366 million (9 percent) versus January 2018.
- There are 3.48 billion social media users in 2019, with the worldwide total growing by 288 million (9 percent) since this time last year.
- 3.26 billion people use social media on mobile devices in January 2019, with a growth of 297 million new users representing a year-on-year increase of more than 10 percent.
And please be aware: Six people decide what information so much of the world sees: Mark Zuckerberg at Facebook, Sundar Pichai at Google, Larry Page&Sergey Brin at Alphabet, Susan Wojcicki at YouTube and Jack Dorsey at Twitter. The „Silicon Six“ – all billionaires, all Americans – who care more about boosting their share price than about protecting democracy. This is ideological imperialism – six unelected individuals in Silicon Valley imposing their vision on the rest of the world, unaccountable to any government and acting like they’re above the reach of law. (https://t1p.de/kqi6).
There are various sources that provide useful instructions on how to evaluate the trustworthiness of an information source. The following chart provides and excellent summary comprising eight different steps. Source is the International Federation of Library Associations and Institutions (IFLA), the leading international body representing the interests of library and information services and their users (https://t1p.de/t3ym):

Citation: „When Oxford Dictionaries announced post-truth was Word of the Year 2016 (see: https://t1p.de/r0nq), we as librarians realize action is needed to educate and advocate for critical thinking – a crucial skill when navigating the information society. IFLA has made this infographic with eight simple steps (based on FactCheck.org’s 2016 article „How to sport fake news“ (see: https://t1p.de/cyy9) to discover the verifiability of a given news-piece in front of you.
Given the fact that information can become quickly outdated, I organize my personal „knowledge base“ as follows:
- When I read an interesting newspaper article, I immediately send an email to myself, which comprises the information source, the headline, the issuing data and the hyperlink to the original source. In rare cases I copy in addition an important quote into the email and sometimes I classify the email with a tag or label. With the help of modern full-text search engines, I can quickly retrieve at a later point of time interesting information from my extensive email database, which now contains around 110,000 emails. I usually remember that there was a good article in the newspaper X about topic Y (and sometimes the approximate time when the article was published).
- Interesting and extraordinary graphics and photos play an important role as eye-catchers in social media and business networks such as LinkedIn and XING. Therefore, I have built up a collection of useful graphics and photos that I save on the hard drive of my iMac and in cloud-based solutions such as Box.net, Dropbox or in the Apple iCloud. In the event that a social media and business network site does not allow uploading graphics or photos (such as XING), I upload the graphic or photo to Postimages.org and use the link the site provides to share the graphic or photo. For editing graphics I can recommend the Movavi Photo Editor.
- Finally, over the years I have built up a list of trustworthy and useful sources of information, which I continually enhance and update. The current status of this list can be found at the end of this blog.
- Since I post information on LinkedIn daily, it is important for me to be able to access this information again at a later date. LinkedIn unfortunately still does not offer a capable search function for content – which I consider as an embarrassment for a leading business network in the information age. There is a workaround to at least recapitulate your own content (e.g. account data, posts, connections and other activities) in form of a so called LinkedIn archive. You can request a download of this archive via „Settings&Privacy“ in the upper right corner of the LinkedIn website and then click on „download your data“. However the process is quite clumsy, since a big chunk of the information is provided in form of Excel tables, and the information provided only covers a certain time span. Similar options are available for Facebook, Instagram and other Social Media Platforms.
- For translation of German webpages into English and vice versa I am using the Google URL translator: http://itools.com/tool/google-translate-web-page-translator or http://free-website-translation.com/, which is based on the Google translation engine. The best English-German Dictionary according to my experience is Linguee (https://www.linguee.com) and the best translation engine for comprehensive text is Deepl (https://www.deepl.com/translator).
- Sometime internet websites are shut down for various reasons. In these cases you may find at https://archive.org/ copies of the website at different times. Archive.org is also useful for reviewing the development of an Internet website over a longer period of time.
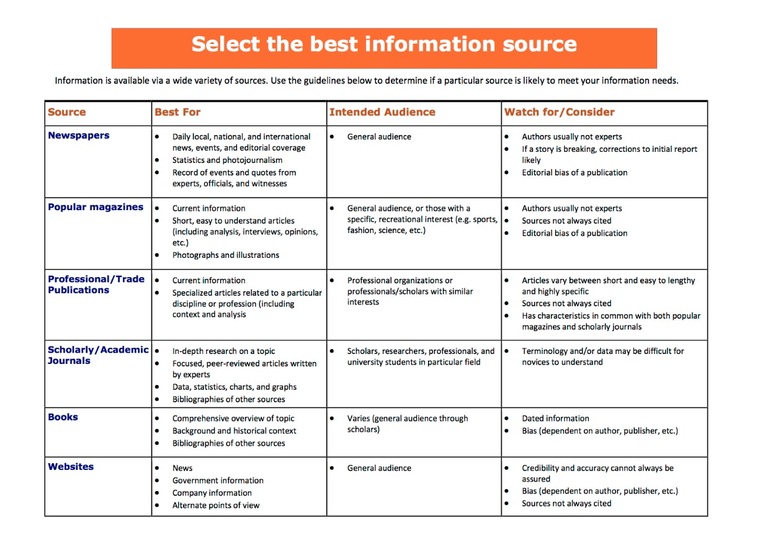
The following table provided orientation which sources of information are best for finding the type of information you need for research projects (source: https://www.library.illinois.edu/ugl/howdoi/selectingsources/).
Final remark: Researchers have long been intrigued by the media’s effect on the public agenda, and how public opinion is formed. In 1922, Walter Lippman, a newspaper columnist, first posed the idea that mass media shape public perception with images. His notion, based on the public’s limited first-hand knowledge of the real world, created the foundation for what has come to be known as „agenda-setting“. The agenda-setting theory claims that media play an influential part in how issues gain public attention.
Conceptualized over time, agenda-setting is the dynamic process „in which changes in media coverage lead to or cause subsequent changes in problem awareness of issues“ (Brosius & Kepplinger, 1990; Lang & Lang, 1981). Bernard C. Cohen predicted in his book „The Press and Foreign Policy“ in 1963: „the press may not be successful much of the time in telling people what to think, but it is stunningly successful in telling its readers what to think about“.
Whether social or political, local or national – public issues are generated by the media – and in today’s era of social media as well by us on Facebook, Twitter, Instagram or LinkedIn. Taking this into account, it is less important how we position ourselves on topics in social media, but which topics we highlight at all and thus put them on the public agenda.
This leads us to another interesting question: Why do lemmings throw themselves off a cliff to death? Maybe, because they don’t know what they’re doing?

There are theories suggesting that public policy makers, political parties, lobbyists and non-governmental organizations (NGO) should become „choice architects“ strategically designing basis and context for individual choices of citizens in areas such as climate change, energy, transportation, nutrition, EU, Euro, or immigration.
This is implemented through communication and manipulation practices and techniques such as #agendasetting, #priming, #framing, #nudging, #persuasion or #coercion (a reading list with more detailed explanations is provided here: https://t1p.de/ok1a).
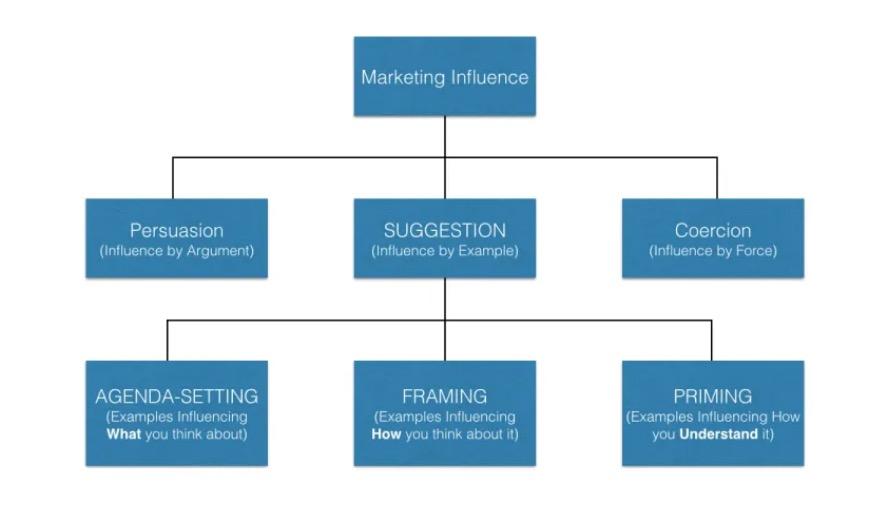
By taking information out of context, using biased language and one-sided arguments, continuously and repeatedly bringing key messages into the people’s minds, or building up little guardrails and hurdles (taxes, policies, norms, …) the lemmings are moved to the cliff in a subtle way and convinced that it’s their mission to jump into the doom.
The only way to defend yourself against these #narratives is to develop a sense of the mechanisms, to get an overview of numbers, data and facts, and to contradict when someone tries to use these mechanisms in public.
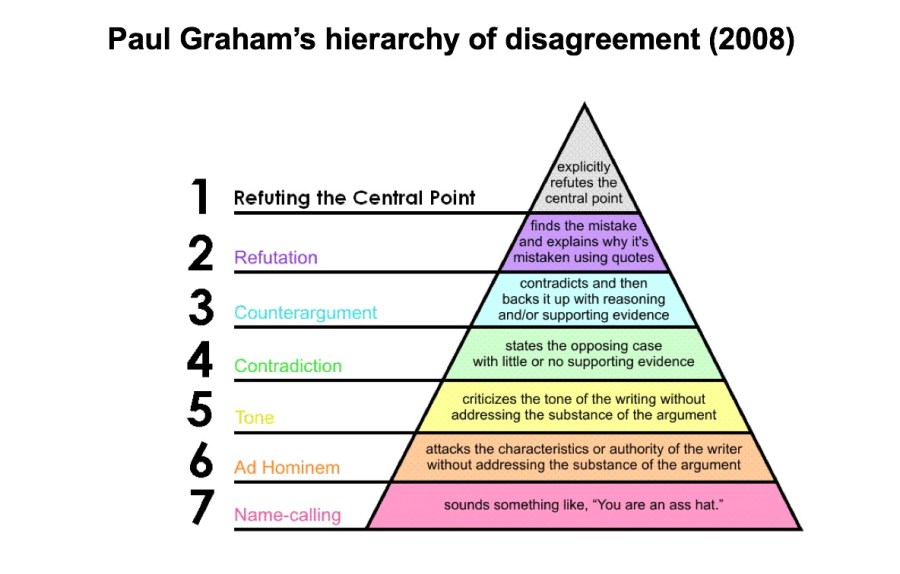
Besides, in discussions with „choice architects“ in social media, Paul Grahams hierarchy of disagreement might be useful – see following chart and explanations provided in a Big Think article published on March 16, 2018, under the headline „How to disagree well: 7 of the best and worst ways to argue“: https://t1p.de/741f.
Having said this, I would now like to provide you with the promised list of valuable general information sources. For my own convenience I have started to build up the following list with most useful links and information sources, which I continuously enhance and update. I would encourage you to click through the links to gather an overview of the information provided by the various information sources. Most of them are really informative and you can learn a lot. If you have proposals, how to enhance and optimize the link list, I am happy to consider your input in the next update cycle of this blog.
GENERAL INFORMATION SOURCES
https://www.rwi-essen.de/unstatistik/
https://techjury.net/stats-about/internet/
https://ec.europa.eu/eurostat/de/home
https://www.umweltbundesamt.de/
http://www.sozialpolitik-aktuell.de/
http://www.o-ton-arbeitsmarkt.de/
https://www.die-linke.de/themen/arbeit/tatsaechliche-arbeitslosigkeit/
https://www.boeckler.de/index.htm
https://www.iwd.de/artikel/einkommensverteilung-die-oberen-zehn-prozent-403001/
https://www.diw.de/de/diw_01.c.679995.de/vermoegen_in_deutschland_le…rharrt_auf_hohem_niveau.html
https://data.oecd.org/germany.htm
http://www.oecd.org/berlin/themen/pisa-studie/
https://medium.com/future-crunch/99-good-news-stories-you-didnt-hear-about-in-2019-c9ff92f57cfb (excellent article with many references to valuable information sources)
https://artsandculture.google.com/
https://www.theglobaleconomy.com/
http://www.worldometers.info/world-population/population-by-country/
http://www.visualcapitalist.com/population-every-country-bubble/
https://wearesocial.com/blog/2019/01/digital-2019-global-internet-use-accelerates
http://www.un.org/sustainabledevelopment/
https://www.abgeordnetenwatch.de/
https://www.iea.org/publications/marketreportseries/
https://www.compareyourcountry.org/
http://www.compareyourcountry.org/taxing-wages?lg=en
https://census.ukdataservice.ac.uk/
https://www.ukdataservice.ac.uk/
http://www.nationalarchives.gov.uk/
https://oedb.org/ilibrarian/best-online-research-sites/
https://academic.microsoft.com/home
https://www.ncbi.nlm.nih.gov/pubmed/
https://www.ncjrs.gov/index.html
https://www.cia.gov/library/publications/the-world-factbook/index.html
https://www.imf.org/external/index.htm
http://www.nationaldebtclocks.org
https://www.visualcapitalist.com/
https://money.visualcapitalist.com/
https://www.mekkographics.com/
https://www.handelsblattmachtschule.de/angebote/wirtschaft-aktuell/infografik.html
https://coinmarketcap.com/all/views/all/
http://www.laenderdaten.de/wirtschaft/waehrungen.aspx
http://www.shadowstats.com (note: interesting but criticized as conspiracy theory minded)
https://www.die-linke.de/themen/arbeit/tatsaechliche-arbeitslosigkeit/2019/
https://www.credit-suisse.com/about-us/en/reports-research/global-wealth-report.html
https://www.eiu.com/n/global-democracy-in-retreat/
https://www.eiu.com/public/topical_report.aspx?campaignid=democracyindex2019
https://crackedlabs.org/en/corporate-surveillance
https://www.elaxa.ch/portfolio/corporate-surveillance-in-everyday-life/
https://www.timeshighereducation.com/world-university-rankings/2018/world-ranking
http://n-heydorn.de/steuermodelle_merz_solms_kirchhof
https://www.destatis.de/DE/ZahlenFakten/GesellschaftStaat/Bevoelkerung/Mikrozensus.html
https://flowingdata.com/2015/09/23/years-you-have-left-to-live-probably/
https://www.destatis.de/DE/ZahlenFakten/_Querschnitt/Fluechtlinge/Fluechtlinge.html
https://www.bamf.de/DE/Infothek/Statistiken/statistiken-node.html
https://ec.europa.eu/eurostat/de/web/asylum-and-managed-migration/data/database
https://en.wikipedia.org/wiki/List_of_Nobel_laureates_by_country
https://www.deutsche-startups.de/
https://www.basicthinking.de/blog/
http://www.foerderdatenbank.de
https://www.socialmediatoday.com/
https://www.ivw.eu/aw/print/qa
https://www.youtube.com/channel/UCEJDM_70A2EiRqZ41l6bZlg (YouTube Channel 100SekundenPhysik in German)
https://www.merriam-webster.com/
https://en.wikipedia.org/wiki/List_of_fact-checking_websites
https://newscollab.org/2019/01/24/8-resources-to-detect-fake-news/
https://www.bmvi.de/SharedDocs/DE/Artikel/G/mobilitaet-in-deutschland.html
http://time.com/4116259/google-search-2/
https://www.lifehack.org/articles/technology/20-tips-use-google-search-efficiently.html
https://detailed.com/tech-blogs/ (list of 50 most popular tech blogs with highest click-rates, such as BusinessInsider.com, TheVerge.com, TechCrunch.com, ArsTechnica.com, HackerNoon.com, …)
Best tech, innovation and inspiration channels on YouTube:
▶︎ TEDx Talks: https://www.youtube.com/user/TEDxTalks
▶︎ CNET: https://www.youtube.com/user/CNETTV
▶︎ Business Insider: https://www.youtube.com/user/businessinsider
▶︎ Wired: https://www.youtube.com/user/wired
▶︎ The Verge: https://www.youtube.com/user/TheVerge
▶︎ Cheddar: https://www.youtube.com/channel/UC04KsGq3npibMCE9Td3mVDg
▶︎ Tech Crunch: https://www.youtube.com/user/techcrunch
▶︎ Marquess Brownlee: https://www.youtube.com/user/marquesbrownlee
▶︎ Interesting Engineering: https://www.youtube.com/channel/UCEuiOszNd6msGgqsD0f9YAQ
▶︎World Economic Forum: https://www.youtube.com/user/WorldEconomicForum
▶︎ Harvard Innovation Labs: https://www.youtube.com/user/Harvardilab
▶︎ HackerNoon: https://www.youtube.com/channel/UChu5YILgrOYOfkfRlTB-D-g
▶︎ Ars Technica: https://www.youtube.com/user/arstechnicavideos
▶︎ TechZone: https://www.youtube.com/channel/UC6H07z6zAwbHRl4Lbl0GSsw
▶︎ Seeker: https://www.youtube.com/user/DNewsChannel
▶︎ BuzzFeed Video: https://www.youtube.com/user/BuzzFeedVideo
▶︎ Tech Tomorrow: https://www.youtube.com/user/techtomorrow
▶︎ Freeze Lists: https://www.youtube.com/user/EnzoShelby67
▶︎ Unbox Therapy: https://www.youtube.com/user/unboxtherapy
▶︎ Blossom: https://www.youtube.com/channel/UC2WuPTt0k8yDJpfenggOAVQ
▶︎ 5-Minuten Tricks: https://www.youtube.com/channel/UC8-0f1PAWAqjdtk9ajwtmqg
▶︎ Cool Gadgets & Stuff: https://www.youtube.com/channel/UCtSGuVQVej-vjeSv_xF-8BQ
▶︎ Terra X Lesch & Co.: https://www.youtube.com/channel/UC5E9-r42JlymhLPnDv2wHuA
▶︎ LADB Restoration: https://www.youtube.com/channel/UC8AvcEE8l8mHs-rZTXoynVQ
Learning platforms for students and adults:
▶︎ Sofatutor: https://www.sofatutor.com/
▶︎ Simpleclub: https://simpleclub.com/de/
▶︎ Skillshare: https://www.skillshare.com
▶︎ IVI-Education: https://ivi-education.de/ts-teams/marcus-gummelt/
▶︎ Sebastian Schmidt: https://www.youtube.com/user/DaHugo82
▶︎ Edu-Sense von Anika Buche: http://www.edu-sense.de
https://en.wikipedia.org/wiki/List_of_newspapers_in_the_United_States#By_circulation (list of major newspapers in the United States by weekday circulation, such as USA Today, Wall Street Journal, New York Times, New York Post, Los Angeles Times, The Washington Post, …)
https://en.wikipedia.org/wiki/List_of_newspapers_in_the_United_Kingdom (list of major newspapers in the United Kingdom such as The Times, The Guardian, The Observer, The Independent, The Financial Times, Economist, …)
https://en.wikipedia.org/wiki/List_of_newspapers_in_Germany (list of major newspapers in Germany such as SZ, FAZ, WELT, BILD, Handelsblatt, Wirtschaftswoche, Cicero, SPIEGEL, STERN, Focus, …)
https://en.wikipedia.org/wiki/List_of_newspapers_in_Switzerland (list of major newspapers in Switzerland such as NZZ, 20 Minuten, Blick, Basler Zeitung, …)
https://de.wikipedia.org/wiki/Liste_%C3%B6sterreichischer_Zeitungen_und_Zeitschriften (list of major newspapers in Austria such as Der Standard, Die Presse, Heute.at, …)
http://www.wirtschaftswoche.de
https://t1p.de/7kbi (Medium.com article published on September 15, 2016, under the headline „The Greatest Sales Deck I’ve Ever Seen“)

Complementary readings:
- „Popularity ranking of my LinkedIn-blogs“ published on July 29, 2019, on LinkedIn: https://www.linkedin.com/pulse/popularity-ranking-my-linkedin-blogs-kurt-brand/
- A comprehensive introduction into „Digital business models and Platform Economy“ is provided in my blog published on November 4, 2017: https://kubraconsult.blog/2017/11/04/digital-business-models-and-platform-economy/ (German version: https://kubraconsult.blog/2017/09/06/digitale-geschaeftsmodelle-und-plattformoekonomie/)
- The socio-economic consequences of Digitalization are described in my blog of the same name published on March 17, 2017: https://kubraconsult.blog/2017/03/17/the-socio-economic-consequences-of-digitalization/ (German version: https://kubraconsult.blog/2017/03/14/die-soziooekonomischen-folgen-der-digitalisierung/)
- Thoughts on the basics of change are provided in my blog of the same name published on August 28, 2018 (so far only available in English language): https://kubraconsult.blog/2018/08/28/basic-prerequisites-for-effective-change/
- „Facts and Figures on climate change and global warming“ published on May 12, 2019: https://kubraconsult.blog/2019/05/12/secrets-and-lies-of-the-climate-change/ (this blog is so far only available in English language)

Eine unglaubliche Produktivität sehe ich hier am Werk. Ich verneige mich.