The discussions around climate change and global warming are full of half-truths and myths launched by various parties and lobbyist groups in the interest of their own political or ideological agenda. You need to understand this, if you want to build up a reasonable opinion on the complex matter.
In May 2019, I took the opportunity to dig deeper into the topic. As usually, I started to get an overview by collecting facts from reliable sources, which I challenged and validated in a lot of discussions on Twitter and LinkedIn. The result of my little research is this comprehensive and hopefully informative blog.
Let’s start with the following citation taken from a Thwink.org article published in 2014 under the headline „The IPAT Equation„:
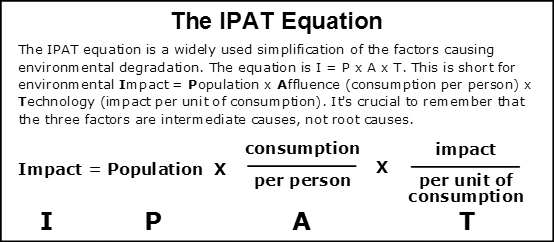
„If you want to understand what’s causing the environmental sustainability problem, the place to start is the IPAT equation. At least that’s how I felt in August 2001 when first reading about the equation. Night became day. I was electrified as all of a sudden I felt I was at last starting to grasp the true nature of the sustainability problem. […] The IPAT equation is the foundation for initial analysis of the cause of environmental unsustainability. It’s the basic question behind the entire World3 simulation model, the one used in the blockbuster best seller The Limits to Growth in 1972. […] The World3 simulation model, the most influential model of all time for the sustainability problem, is basically an IPAT equation model. That’s what you need for identifying the problem. But it’s not what you need for solving it. Solving the problem requires „a systems approach“ under consideration of the important insight, that the 3 factors (Population, Affluence and Technology) are intermediate causes, not root causes.“
So it seems we have to dig a little bit deeper to identify the root causes behind Population, Affluence and Technology. In terms of population, female empowerment is for example the most effective carbon mitigation strategy. Family planning enables women to have only children they want and choose, and education of girls gives them access to income opportunities outside their home. We know that women, given the resources and the choice, will opt for smaller families. Source of this analogous citation is a vox.com article published on November 29, 2018, under the headline „I’m an environmental journalist, but I never write about overpopulation. Here’s why.„.
The biggest threat to global warming
Based on verifiable facts, I will explain in the following, why growth of population and wealth primarily in developing and emerging countries is by far the biggest threat to global warming – if (and this is a very big „if“) this growth cannot be organized in an climate-friendly way. This would require e.g. the rapid development and implementation of technologies for CO2-free production of steel and cement as major sources of CO2 emissions, as well as the removal of CO2 from the atmosphere by means of bio or carbon engineering, which seems to be a promising approach. This includes Carbon Capture Storage (CCS) technologies as well as reforestation of woodland to remove CO2 from the atmosphere.
The following intelligent and informative chart already provides a basic understanding of the problem. The chart illustrates the worldwide CO2 emissions per country/region against two important dimensions: size of population and CO2 emissions per capita. The data comes from the International Energy Agency (IEA), was published in 2018 and shows the 2016 status. The total CO2 emissions of a country/region are represented through a rectangle. The height of each rectangle reflects the CO2 emissions per capita and the width reflects the population. Countries/regions are sorted by CO2 emissions per capita, from the highest to the lowest.
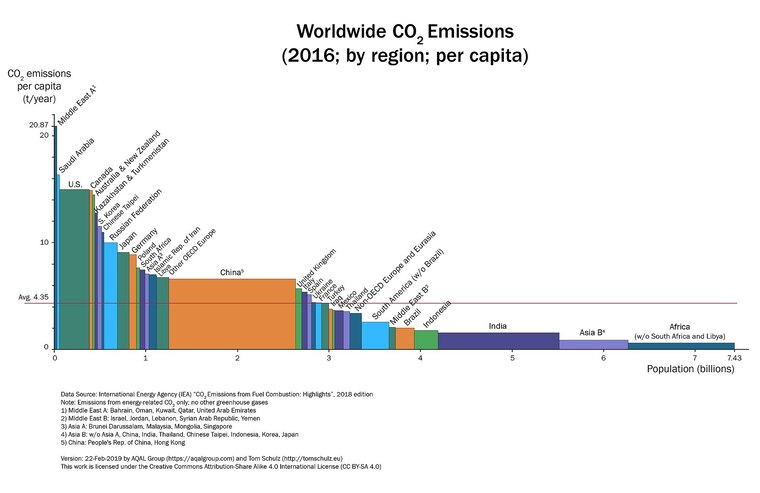
Large population plus high CO2 emissions per capita is a bad combination, which applies e.g. to the USA or China. Growth of population and wealth is also important since it affects the future CO2 emissions. According to UN forecasts, Africa will double its population to 2.5 billion people by 2050. India ranks 2nd with an increase by 320 million to 1.66 billion people by 2050. If the 54 African states reach only 50% of Germany’s per capita emissions of 8.8 tons in 2017 within the next 30 years, as a result of increasing wealth, then 11,000 megatons of CO2 will be emitted by Africa in 2050, which is equivalent to 30% of global CO2 emissions in 2017.
Facts and arguments on heavily disputed topics
In addition to the explanations, why growth of population and wealth primarily in developing and emerging countries is by far the biggest threat to global warming, I will provide facts and arguments on heavily disputed topics such as:
- the impact of human breathing and human consumption of goods and services on climate change
- why individual electro mobility is not a panacea for improving the climate-friendliness of the transport sector
- the „Fridays for Future“ movement and its claims to step out of fossile energy sources and only rely on renewable energy sources as quickly as possible vs. security of energy supply (difference between primary energy consumption and gross electricity production)
- to what extent considerations on per capita CO2 emissions and historical CO2 emissions make sense
- the claim that China and India have increased their CO2 emissions just because developed countries outsourced CO2 intensive production tasks to these countries in course of the last 40 years
- the impact of meat consumption in developed countries on climate change
- the Paris Agreement and its construction failures
- unexpected side-effects of a Carbon/CO2-tax
Step by step: understanding on the complex matter
But let’s go step by step and develop an understanding on the complex matter.
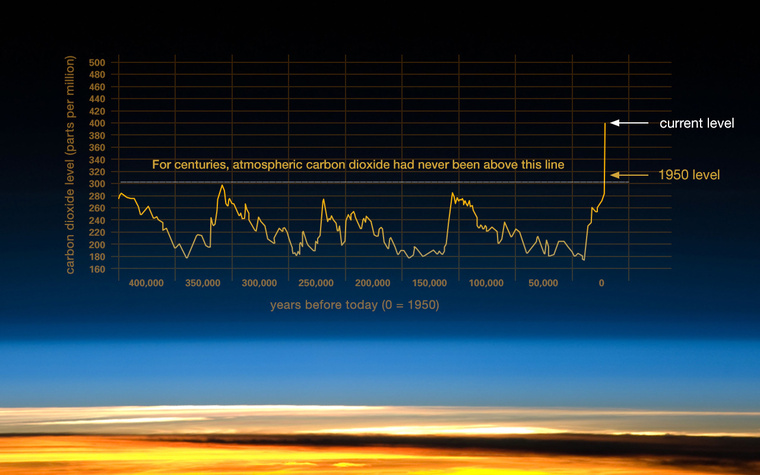
The following chart provided by the NASA illustrates „the relentless rise of carbon dioxide in the atmosphere“ between 400,000 B.C. and today. Besides methane, human made CO2 emissions are supposed to be the major root cause responsible for global warming:
What would you do, if you had to fix a complicated problem which is caused by several parties, that you cannot control? Imagine you have a plot on a lake surrounded by 200 plots with different owners. At some point of time you notice that the water quality of the lake is getting worse and worse. You investigate the causes and find that all landowners discharge their sewage and other waste into the lake.
Major sources of greenhouse gas emissions including CO2
So, how would you try to resolve the problem, which significantly affects your quality of life? Maybe by identifying the major emitters of sewage and waste and trying to shape the major levers of pollution by following the 80:20 rule? Does this make sense? Okay, let’s try to follow this approach.
The following charts are taken from an article published by the United States Environmental Protection Agency (EPA) based on data provided by the Intergovernmental Panel on Climate Change (IPCC) in 2014. They illustrate the global greenhouse gas (GHG) emissions by gas and by economic sector in 2014. The data are 5 years old, but this doesn’t matter for our purposes since the overall picture hasn’t fundamentally changed in course of the last 5 years.
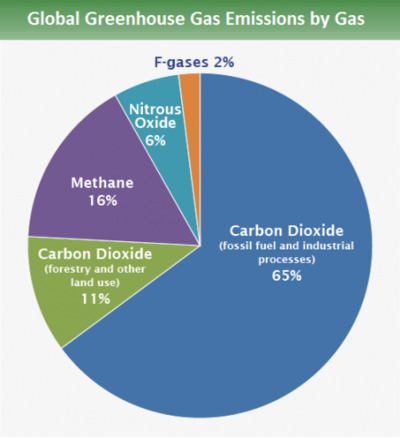
As the chart above illustrates, 76% of the global greenhouse gas emissions in 2014 consisted of CO2 and 16% of methane, i.e. together both gases are responsible for 92% of all greenhouse gas emissions. Besides, we need to keep in mind that methane is more harmful with regard to global warming than CO2.
According to the German Federal Environmental Agency, Methane is 25 times more harmful than CO2, but it has only a 12.4 year atmospheric residence time, while CO2 can remain in the atmosphere for up to 1,000 years. N2O is 298 times more harmful than CO2 and has a residence time of 121 years.
Many F-gases are extremely greenhouse effective even in comparison to methane and N2O. Their residence time in the atmosphere is also enormously long. However, they do not occur in nature, but are produced to be used as propellants, cooling and extinguishing agents or as a component of soundproofing panes.
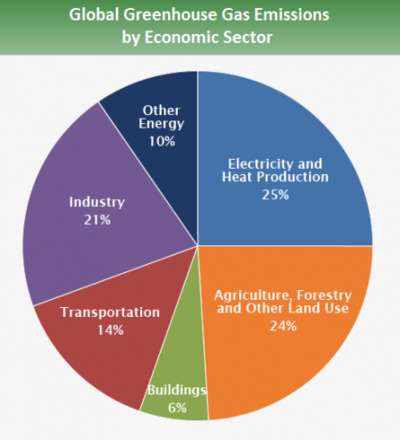
The second chart above illustrates the greenhouse gas emissions by economic sector in 2014. 25% of GHG emissions in 2014 was caused by electricity and heat production, 24% by agriculture, forestry an other land use, 21% by industry, and 14% by transportation. Again, together these four sectors contributed in 2014 a whopping 84% to the global greenhouse gas emissions.
Major drivers for CO2/GHG emissions
Let’s now take a look at the „landowners“, i.e. those countries, which contribute the most CO2 to the global CO2 emissions. The following table is based on data from 2017 (so just two years old), where the global CO2 emissions amounted to 36,153 Megatons (data is taken from Globalcarbonatlas homepage):
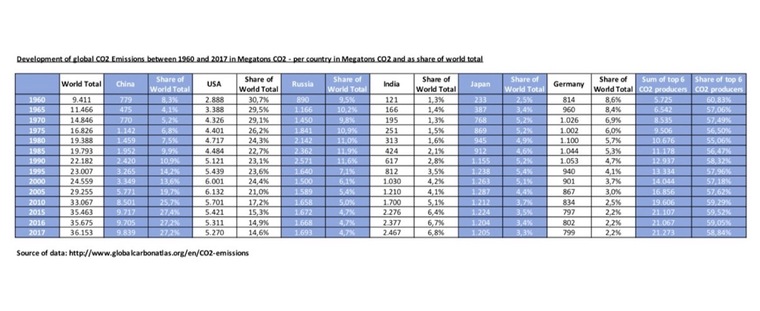
This really important table displays the following facts:
- With 9,839 Megatons of CO2 (equivalent to a global share of 27,2%), China was in 2017 by far the biggest global emitter of CO2. Between 1960 and 2017, China’s CO2 emissions increased more than twelvefold from 779 Megatons in 1960 (8.3% of global emissions) to 9,839 Megatons in 2017 (27.2% of global emissions).
- With 5,270 Megatons of CO2 (equivalent to a global share of 14.6%), the USA were in 2017 by far the second biggest global emitter of CO2. Between 1960 and 2017, the U.S. CO2 emissions almost doubled from 2,888 Megatons in 1960 (30.7% of global emissions) to 5,270 Megatons in 2017 (14.6% of global emissions).
- Ranks three, four and five in the global CO2 emission ranking 2017 are occupied by India (CO2 emissions increased from 121 Megatons equivalent to 1.3% in 1960 more than twentyfold to 2,467 Megatons equivalent to 6.8% in 2017), Russia (CO2 emissions increased from 890 Megatons in 1960 equivalent to 9.5% to 1,693 Megatons in 2017 equivalent to 4.7% in 2017) and Japan (CO2 emissions increased from 233 Megatons equivalent to 2.5% in 1960 to 1,205 Megatons equivalent to 3.3% in 2017).
- These top five global CO2 emitters contributed in 2017 in total 20,474 Megatons CO2 to the global CO2 emissions of 36,153 Megatons, which is equivalent to almost 57%.
- Germany ranks no. 17 in terms of population with 82.89 million people in 2018 (equivalent to 1.09% of 7.63 billion global population), no. 4 in terms of GDP with US-$4,117 trillion on nominal basis in 2019 (equivalent to 4.67% of US-$88.081 trillion global GDP) and no. 6 in terms of CO2 emission with 799 Megatons CO2 emissions in 2017 (= 2.21% of 36,153 Megatons CO2 total global emissions). This means Germany’s share of the global CO2 emissions is comparably small and – more important – Germany was between 1960 and 2017 the only country amongst the top six global CO2 emitters, which could reduce its CO2 emissions. In fact, Germany decreased its CO emissions from 814 Megatons in 1960 (8.6% of global emissions) to 799 Megatons in 2017 (2.2% of global emissions), which has to a certain extent to do with the German reunification and the closing of many heavy industry sites in Eastern Germany.
The table above already provides the basis for a conclusion, what needs to be done to effectively influence global warming. It is supported by the following chart, which illustrates the development of atmospheric CO2 level between 400,000 B.C. and today, the development of the annual CO2 emissions by world region between 1751 and 2015, the development of the World population over the last millennium and the development of the global GDP over that last two millennia:

The obvious conclusion from the tables and charts above is: Growth of population and wealth is by far the biggest root cause for increasing CO2 emissions and therefore for global warming.
So, let’s take a more detailed look into both topics and try to build up an understanding, where growth of population and wealth primarily will take place in the upcoming decades and why it affects global warming.
Population growth as first major driver
The following chart illustrates the global population in 2019 of 7.704 billion people – therein 1.052 billion people (13.66%) living in 35 developed countries and 6.652 billion people (86,34%) living in 198 emerging and developing countries, i.e. the population in developing countries is more than 6.3 times the population in the developed countries with increasing tendency. By 2050 the developed countries will keep their level in absolute numbers only because migration to the U.S. offsets population decreases in large European countries and Japan, while the increase of global population by 2.1 billion humans will mainly take place in Africa (+1.25 billion) and India (+320 million) as we will see in a minute.
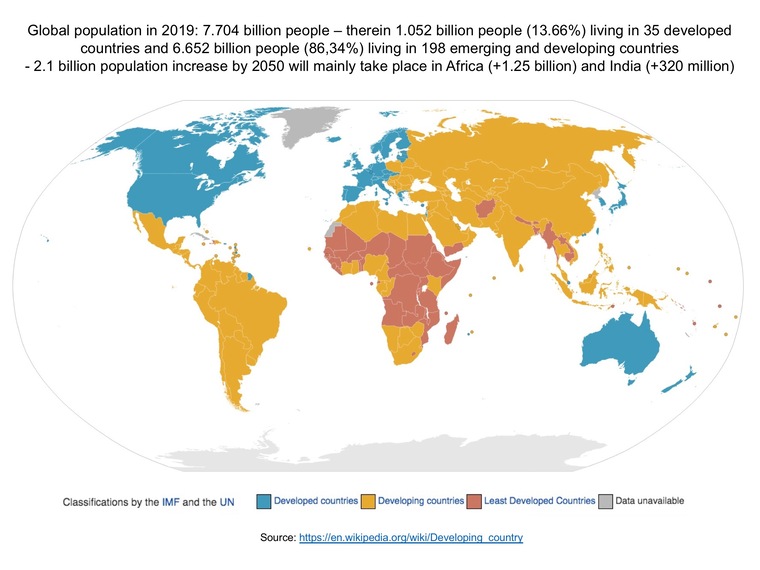
The numbers in the headline of the last chart are taken from https://www.worldometers.info and https://www.worldometers.info/world-population/population-by-country/.
The next chart provides projections on the population growth in the upcoming approx. 30 years between 2017 and 2050 (source: https://www.dsw.org/wp-content/uploads/2017/06/UN-Weltbev%C3%B6lkerungsprojektionen_2017_Grafiken.pdf):
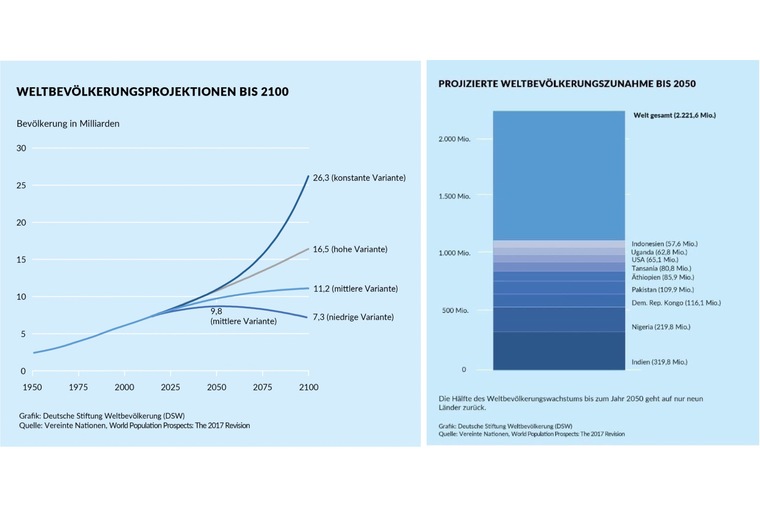
As the graphics on the left hand side above shows, there are various projections based on different assumptions and fertility rates. In the worst case (rather unlikely) scenario the global population will grow from 7.6 billion humans in 2017 to 26.3 billion people in 2100 (assumption: constant growth rate). The most realistic projection assumes that the global population will increase within the next 30 years by 2.2 billion humans to 9.8 billion humans in 2050 and afterwards will decrease to 7.3 billion people in 2100.
The interesting question is, which countries and regions contribute most, to the projected increase of 2.2 billion humans by 2050? According to the UN data, by 2050, Africa is expected to double its population to 2.5 billion people, followed by India which goes up by 24% to 1.66 billion people and China which is expected to slightly decrease to 1.36 billion people. Africa, India and China will by 2050 contribute more than 56% to the global population of 9.8 billion people. More than 70% of the 2.2 billion humans, which increase the global population in the upcoming 30 years, will be born in Africa (1.25 billion) and India (320 million), as the graphics on the right hand side above shows.
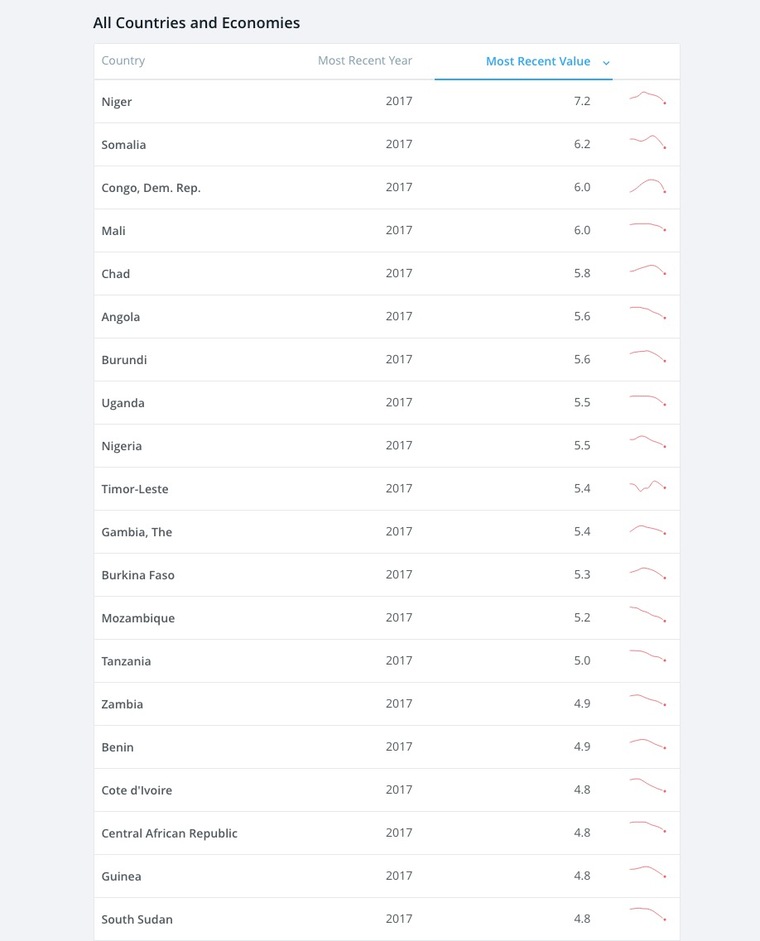
Side note: Today, the top 20 countries with the highest fertility rate include 19 countries from Africa plus Timor-Leste at rank 10, as the following table illustrates (source: https://data.worldbank.org/indicator/sp.dyn.tfrt.in?most_recent_value_desc=true).
Complementary information on the population growth in Africa is provided in an article issued by the German Foundation for World Population on June 21, 2017, under the headline „New UN projections: World population to grow to 9.8 billion by 2050“: https://www.dsw.org/neue-un-bevoelkerungsprojektionen-2017-entwicklung-weltbevoelkerung-bis-2100/.
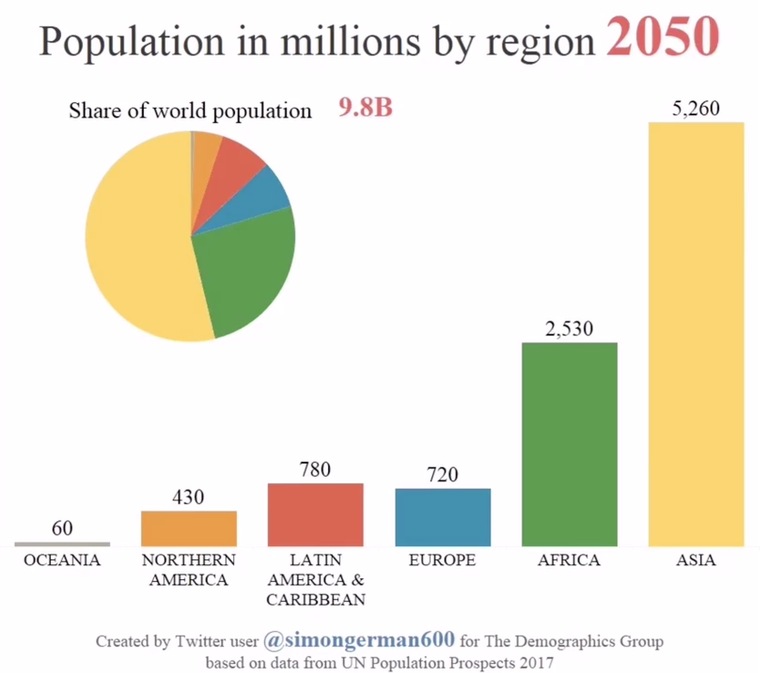
The following chart should serve as a conclusion for the considerations on growth of population as it shows the expected distribution of the global population in 2050 by regions:
Wealth growth as second major driver
Let’s now move on to the important topic of wealth growth. In the past, wealth growth has been directly linked to the consumption of resources and the emission of CO2 and greenhouse gases, as the table above based on data from Globalcarbonatlas.org already vividly illustrates for emerging economies, such as China and India.
A YouTube video published by WaWaMuStats on September 6, 2018, under the headline „Top 10 Country GDP Ranking History (1960-2017)“ illustrates the impressive economic development taken by China and India between 1960 and 2017: https://youtu.be/wykaDgXoajc. During these 57 years (inflation not considered), China increased its nominal GDP in billions of USD almost by factor 200 and India by almost factor 68 (USA: factor 35).
However, much more deciding for the global warming, than the past economic growth, is the current and future economic growth.
The next chart is taken from an article published on September 26, 2016, by the Mercatus Center of the George Mason University in Arlington/USA under the headline „At 2 Percent Growth Rate, It Would Take 35 Years to Double the Size of the US Economy„:
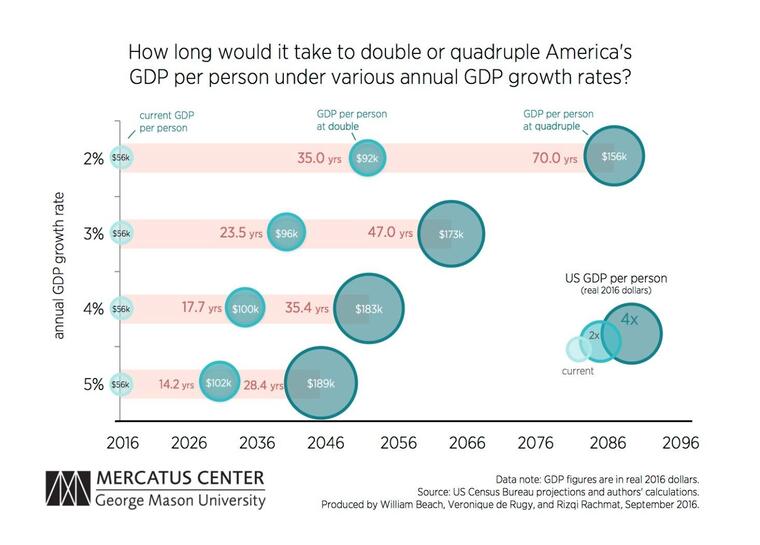
The absolute $ amounts mentioned in the chart above are U.S. specific, however, the following overall logic applies in general for all countries:
- At 2% annual growth rate, a country’s GDP doubles within 35 years and quadruples within 70 years
- At 3% annual growth rate, a country’s GDP doubles within 23.5 years and quadruples within 47 years.
- At 4% annual growth rate, a country’s GDP doubles within 17.7 years and quadruples within 35.4 years.
- At 5% annual growth rate, a country’s GDP doubles within 14.2 years and quadruples within 28.4 years.
The following comparison of the growth rates of emerging countries, such as China and India with the growth rates of developed countries, such as the USA and Germany, shows an important difference which has already significantly affected global warming in the past 60 years:
- China’s GDP annual growth rate averaged 9.52% from 1989 until 2019, reaching an all time high of 15.40% in the first quarter of 1993 and a record low of 3.80 % in the fourth quarter of 1990 (source: https://tradingeconomics.com/china/gdp-growth-annual)
- India’s GDP annual growth rate averaged 6.21% from 1951 until 2018, reaching an all time high of 11.40% in the first quarter of 2010 and a record low of -5.20% in the fourth quarter of 1979 (source: https://tradingeconomics.com/india/gdp-growth-annual).
- The USA’s GDP Annual Growth Rate averaged 3.20% from 1948 until 2019, reaching an all time high of 13.40% in the fourth quarter of 1950 and a record low of -3.90% in the second quarter of 2009 (source: https://tradingeconomics.com/united-states/gdp-growth-annual).
- Germany’s GDP Annual Growth Rate averaged 2.01% from 1971 until 2018, reaching an all time high of 7.20% in the first quarter of 1973 and a record low of -6.80% in the first quarter of 2009 (source: https://tradingeconomics.com/germany/gdp-growth-annual).
The projections for the development of wealth growth in the upcoming 30 years by 2050 are very clear and show unambiguously that China and India both will outperform the USA as largest global economies in course of the upcoming 30 years. Japan as third largest global economy today and Germany as fourth largest economy today will continue to grow, however, they will be overtaken by emerging countries such as Indonesia, Brazil, Russia and Mexico and drop from ranks 3 and 4 today to ranks 8 and 9 in 2050.
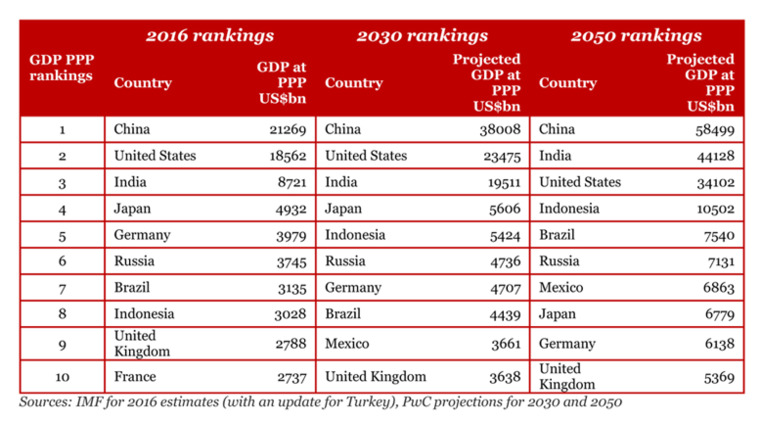
Note: The last chart above is based on Purchasing Power Parity (PPP), which is a way of measuring economic variables in different countries so that irrelevant exchange rate variations do not distort comparisons.
I would like to add a complementary citation from an interesting WEF video published in April 2019 on a Chinese coffee company:
„China’s rapid economic growth has raised the incomes of huge numbers of its people. In 2000 just 4% of China’s urban households had middle-class incomes – compared to 68% in 2012 (source: McKinsey). By the mid-2020s, 780 million Chinese people are expected to have middle-class incomes (source: Bookings). And businesses are racing to supply what these new customers demand.“
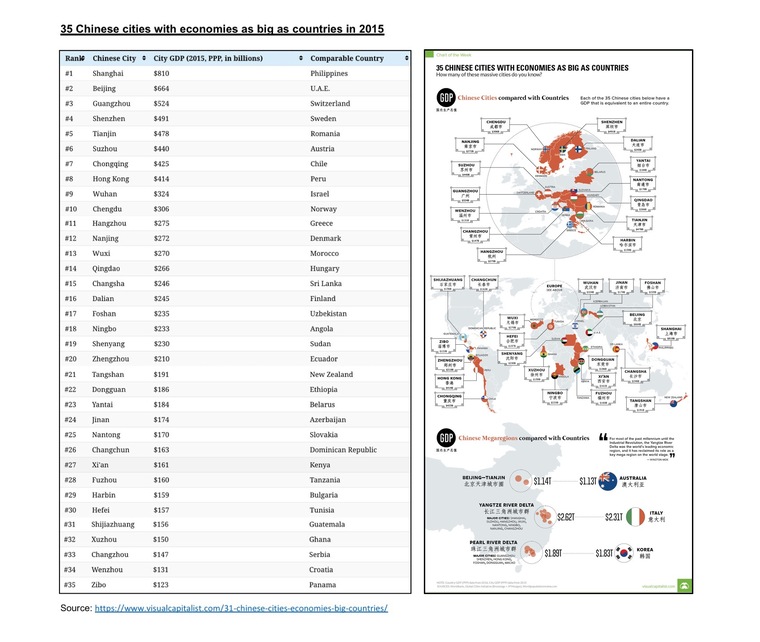
In 2015, there were already 35 Chinese cities with economies as big as the one’s of developed countries, such as New Zealand, Norway, Sweden, Finland, Denmark, Switzerland or Austria on Purchasing Power Parity (PPP) basis, as the following chart published in November 2017 on the Visualcapitalist homepage illustrates:
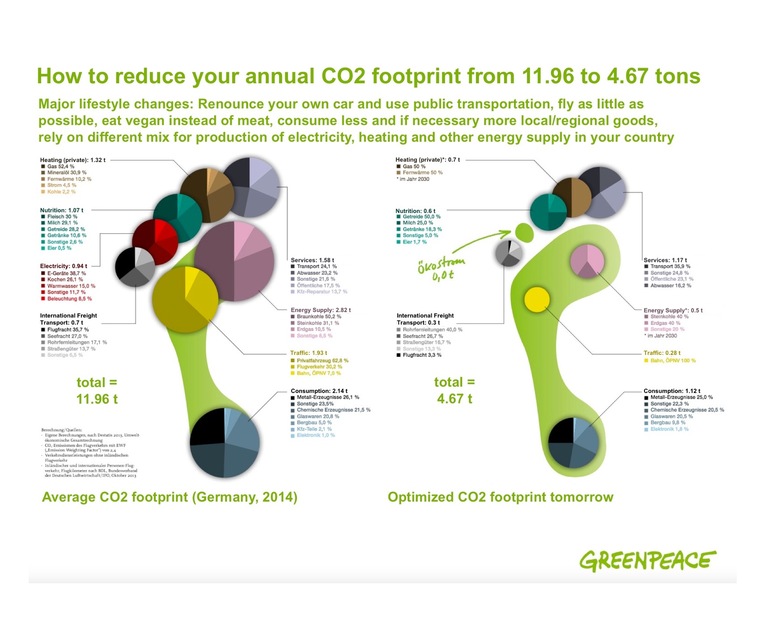
The more wealthy people are, the more they consume. If the consumed goods and services are not climate-friendly, the CO2 emissions will increase. The following chart was published by Greenpeace Germany in an article on October 6, 2014, in German language under the headline „Our CO2 footprint“ (automatic English translation: https://t1p.de/w2lr).
Important note: I have translated the headlines of the original Greenpeace chart into English and added a sub-headline, which describes the major lifestyle changes recommended to reduce the CO2 footprint. All numbers mentioned in the chart refer to Germany, are at least 5 years old and most likely outdated. However, the overview on major influencing factors on an average German’s CO2 footprint and the relation of these influencing factors amongst each other is still informative from my point of view.
Complementary summary extracted from a Krautreporter.de article published on July 25, 2019 under the headline „What you can do to reduce your CO2 footprint„:
- Pay attention to your nutrition, eat above all regional&seasonal foods, consume less meat, fish&dairy products, pay attention to trustworthy eco-labels („Bioland“ or „Naturland“) and throw away as little as possible.
- Move sustainably, walk or take the bicycle, public transport or train, at least as little as possible the car. If you can’t do without a car, use (private) car sharing. Avoid flights.
- Consume more consciously, buy quality products that are durable and can be repaired, repair broken things and clothing. Ask yourself about new purchases: Do I really need this?
- Avoid garbage, use reusable bags instead of always new plastic bags, buy fruits and vegetables preferably without packaging, replace disposable products with reusable ones.
- Give your money to a bank that cares about sustainability (in Germany, e.g. GLS Bank or Umweltbank).
- Organize your living space efficiently, e.g. through good insulation, heat pumps, electricity from sustainable energy production or eco gas. If possible, heat less, wash less hot, shower rather than bathe, practice airing rather than tilting windows permanently. Use appliances with A+++ seal and switch all appliances off when not in use.“
The conclusion from the facts mentioned above should be very clear: Growth of population and wealth is by far the biggest root cause for increasing CO2 emissions and therefore for global warming. Important: By far the biggest growth of population and wealth will not take place in developed countries and regions, such as the USA or the European Union, but instead in Africa, India, China and other developing and emerging countries.
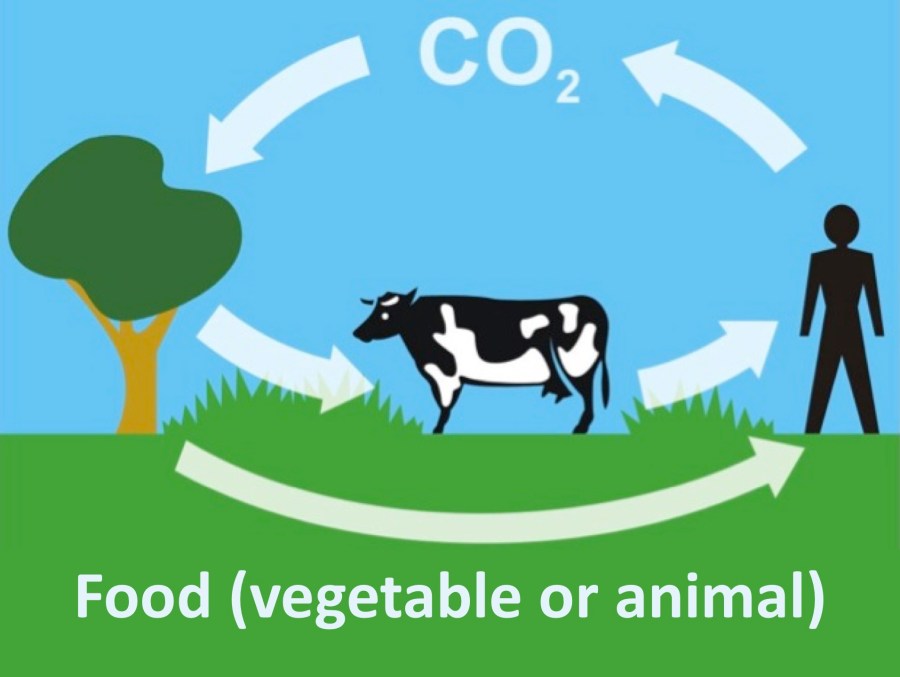
Even more important: If this growth cannot be organized in a climate-friendly way, it will be difficult, if not even impossible, to stop or at least slow down global warming. Germany with its CO2 emissions of 799 Megatons in total (equivalent of 2.2% of global CO2 emissions) in 2017 would not even be able to offset the annual CO2 emissions caused by just the breathing of 2.2 billion humans, which will increase global population in the upcoming 30 years. Environmentalists often argue that human breathing is not harmful to the climate, since the food that humans need to live (vegetable or animal) has previously extracted the same amount of CO2 from the atmosphere as the CO2 emissions from human breathing in a short term cycle. Why it is unfortunately not that simple, is explained in the following excursion.
Short excursion on CO2 emitted by human breathing
A human’s oxygen consumption depends on many factors such as body size/mass and human activity. The proportions of fat and muscles also have an effect: Muscles have a considerably higher basal metabolic rate in relation to fatty tissue, so that muscular people produce more CO2 at rest than untrained people.
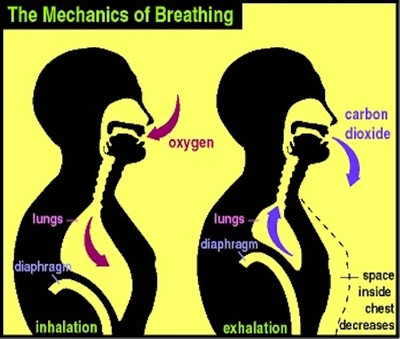
Physical activity makes it even more complex. While at rest about 4 liters of air pass through the lungs per minute, this increases to more than 50 liters per minute during physical exertion. Spread over the year, these two extremes mean 2,100 cbm of air or 168 kg of CO2 at rest compared with 25,500 cbm of air or 2,040 kg of CO2 under continuous exertion.
The individual lifestyle has an enormous influence on our CO2 emissions. On average, we can assume CO2 emissions of 370 kg per human and year just by breathing.
As explained, until 2050 the world population will grow by 2.2 billion people – therein 1.25 billion in Africa + 320 million in India. 2.2 billion people x 370 kg CO2/human = 814 megatons CO2 – just by breathing, without food, clothing, housing or traffic. In 2017, Germany emitted in total 799 megatons of CO2 all in (people, industry, transport, heating, farming, …).
Environmentalists often argue that human breathing is not harmful to the climate, since the food that humans need to live (vegetable or animal) has previously extracted the same amount of CO2 from the atmosphere as the CO2 emissions from human breathing in a short term cycle. Unfortunately this is only the half truth, because this claim neglects important portions of CO2 emissions, e.g. those caused by the:
- production of fertilizers&pesticides for vegetable food
- production of concentrated animal feed (e.g. soya)
- packing&transport of vegetable&animal food
- disposal of packing garbage
If these CO2 emissions are included in the calculation, the CO2 balance looks much differently. Even more, if we consider, that every year, 1.3 billion tons of food are thrown away (source: https://t1p.de/m6s8). A third of what is produced worldwide is lost because it has been damaged during production or transport, or spoils in warehouses, shops and households. In Germany, approx. 55 kilograms of food per capita and year end up in the garbage. In addition, humans consume goods and services, which have not been produced in an climate-friendly way – and the latter is usually getting worse with growing wealth.
On September 14, 2019, someone published on Twitter a calculation of how much energy a bicyclist consumes in addition compared to a car driver, given the fact that the bicyclist must replenish the energy consumed by his physical exertion in form of additional food intake (German: https://t1p.de/0slv, automatic English translation see: https://t1p.de/m0yk ). The result of the calculation at least raises questions as to whether the statement that cycling is environmentally friendly is indeed correct without reservation.
Athletes and heavy physical laborers are ironically more harmful to the climate than office stallions and couch potatoes simply because they consume more energy. In addition, athletes and people with a healthy diet live longer.
Conclusion: It’s complicated …
Some ideas on how to shape population&wealth growth
At this point, I would like to suggest some ideas on how wealth growth in developing and emerging countries could be positively shaped – beyond the inevitable transformation of electricity and heat production – as largest source of greenhouse gases with a 25% share of the global greenhouse gas emissions in 2014 – to renewable energies.
Some ideas on how to improve the climate-friendliness of „agriculture, forestry and other land use“ (with 24% share of global greenhouse gas emissions in 2014 the second biggest driver) are provided here: https://www.thegef.org/topics/agriculture-forestry-and-other-land-uses.
An article published by Deutsche Welle on 21.09.2018 provides food for thoughts on how to stop or at least slow down the population explosion in Africa and India: https://www.dw.com/de/afrika-w%C3%A4chst-unddie-armut-nimmut-zu/a-45596180. Essential levers are education, information and awareness building as well as changing the role of women in society e.g. by education. Furthermore, it must be understood that in poor societies, where, for example, a lot of field work has to be done, many children are more „useful“ than in rich societies, which are characterized by office work. This is one of the reasons why the birth rate decreases with the level of development and prosperity.
The attached chart is taken from a Insideclimatenews.org article published on June 28, 2018, under the headline „These are the toughest emissions to cut, and a big chunk of the climate problem“: https://insideclimatenews.org/news/28062018/global-warming-pollution-industrial-sources-cement-steel-trade-solutions-technology-shipping. The chart is again based on 5 year old data from 2014, however, the shares of the various CO2 sources are today most likely not much differently from 5 years ago:
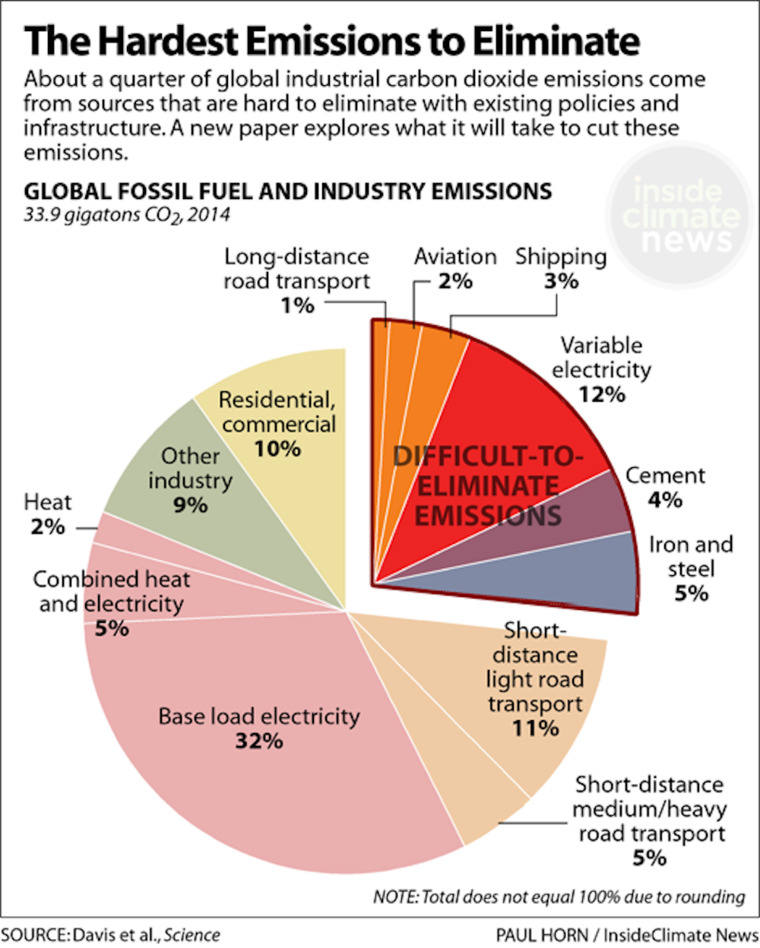
Citation from the insideclimatenews.org article: „Without improvements in shipping, cement and steel, major sources of greenhouse gas pollution will be locked in for generations, new research shows. Efforts to tackle climate change typically focus on boosting renewable energy or using cleaner, more efficient cars, but there’s an entire realm of the economy they’re largely ignoring – one that accounts for about a quarter of global carbon dioxide emissions. These other sources of climate pollution include industrial processes and long-haul shipping, and cutting their emissions will prove particularly difficult. Taken together, these hard-to-cut sources accounted for 27 percent of global CO2 emissions from fossil fuels and industrial sources, according to a paper written by more than 30 leading climate scientists and published Thursday in the journal Science. […] The paper focused on three sectors – long-haul shipping and transportation, cement and steel production, and power generation facilities that are turned on only when needed – that won’t be addressed by most current efforts to cut emissions. Each faces its own set of challenges.“
With 21% share of the global greenhouse gas emissions in 2014, industry is the third largest source of greenhouse gases. Developing and emerging countries need steel and concrete to build roads, railways, factories, schools and houses in course of their development. The production of steel and cement generates large quantities of CO2 and has therefore a significant impact on our climate:
- Up to 8% of the world’s greenhouse gas emissions, are sourced from cement production. If it were a country, the cement industry would be the third largest in the world, its emissions behind only China and the US (source: https://www.theguardian.com/cities/2019/feb/25/concrete-is-tipping-us-into-climate-catastrophe-its-payback-time-cement-tax).
- The global iron and steel industry accounts for approximately 5% of total global CO2 emissions. About 2.8 Megatons CO2 per year are solely related to energy use in the iron and steel sector, about 8% of total energy-related emissions. Source: https://bellona.org/news/ccs/2019-03-is-steel-stealing-our-future.
Various companies and start-ups are currently looking for ways to reduce CO2 emissions in steel production. However, this research is still in its early stages and needs to be boosted.
The following chart is taken from a Washington Post article published on March 24, 2015, under the headline „How China used more cement in 3 years than the U.S. did in the entire 20th Century„.
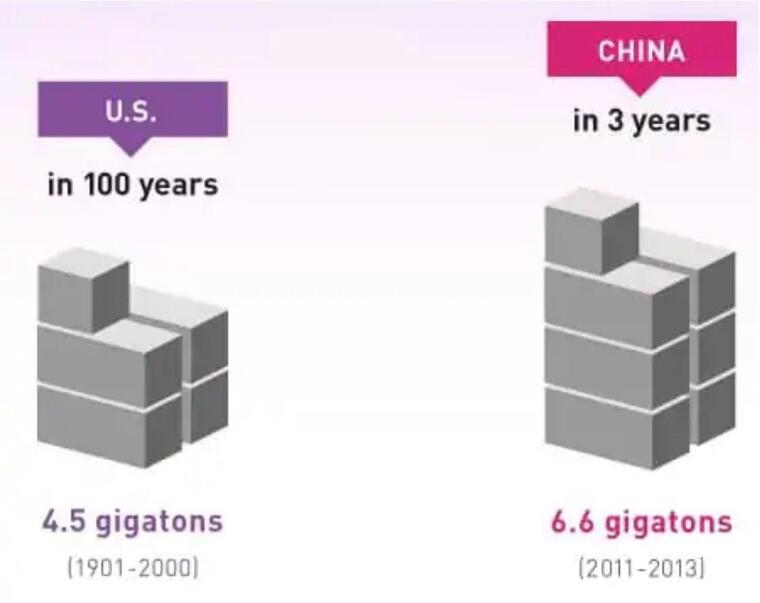
Citation from this WaPo article: „It’s a statistic so mind-blowing that it stunned Bill Gates and inspired haiku. But can it be true, and, if so, how? Yes, China’s economy has grown at an extraordinary rate, and it has more than four times as many people as the United States. But the 1900s were America’s great period of expansion, the century in which the U.S. built almost all of its roads and bridges, the Interstate system, the Hoover Dam, and many of the world’s tallest skyscrapers. And China and the U.S. are roughly the same size in terms of geographic area, ranking third and fourth in the world, respectively.“
China’s „New Silk Road“ initiative is based to a large extent on steel and concrete, which is used for building roads, bridges, railway lines, ports, factories and other buildings.
The World Economic Forum published on March 22, 2019, an interesting article under the headline „Why carbon capture storage (CCS) could be the game-changer the world needs„.
Citation from this article: „CCS can also have a role to play in generating power, as most emissions linked to energy infrastructure are already essentially locked-in. Coal-fired power plants, which account for one-third of energy-related CO2 emissions today, represent more than a third of cumulative locked-in emissions to 2040. Most of these plants are in Asia, where average coal plant is just 11 years old with decades left to operate. Looking ahead, more than 200 GW of coal capacity is under construction globally with 300 new plants to come online in the next few years in India and China alone. CCS is the only technology that can truly decarbonize these facilities.“
Complementary information sources on CCS:
- Finanzen100.de article published on January 5, 2017, in German language under the headline „India owns the first coal-fired power plant that does not blow Co2 into the air“ (automatic English translation see: https://t1p.de/4zkn).
- Financial Times article published on September 25, 2018, under the headline „Scientists attempt to breathe new life into CCS„.
- Guardian article published on June 26, 2019, under the headline „UK’s biggest carbon capture project is step-change on emissions„.
- Scientific American published on July 4, 2019, an article under the headline „Climate: Massive forest restoration could greatly slow global warming„ .
Citation from this article: „We have heard for years that planting trees can help save the world from global warming. That mantra was mostly a statement of faith, however. Now the data finally exist to show that if the right species of trees are planted in the right soil types across the planet, the emerging forests could capture 205 gigatons of carbon dioxide in the next 40 to 100 years. That’s two thirds of all the CO2 humans have generated since the industrial revolution. „Forest restoration is by far our most powerful planetary solution today,“ says Tom Crowther, a professor of global ecosystem ecology at the Swiss Federal Institute of Technology in Zurich, and an author of a study published Thursday in Science that generated the eye-opening number.“
Conclusions for developed countries such as Germany
Well, what does this mean for developed countries such as Germany?
Germany’s biggest service for global climate was not the reduction of its own CO2 emissions by 30 percent in course of the last 30 years (despite doubling GDP and 50% more passenger cars on German streets). Germany’s biggest service for global climate was in fact the funding of the development cost for solar and wind energy (at least to a large extent), which reduced market prices rapidly and led to broad usage of solar and wind energy in many countries.
Following the same logic, Germany can, should and must invest into CO2-free technologies for the production of steel and cement and as well into bio- and carbon-engineering technologies, which will be able to pull CO2 out of the atmosphere (see: „How Sea-Monkeys, Novo Nutrients, and Synthetic Biology Will Save the World“ published in May 2019).
Short excursion on global mobility
Some remarks on the development of global mobility. The mobility of the future is subject to a lot of controversial discussions in many countries including Germany and climate change is (too) often misused in these discussions. Nowadays individual passenger cars are considered by some people as devil’s stuff, which primarily consumes precious resources and space and pollutes the environment.
Let’s take a look at the facts:
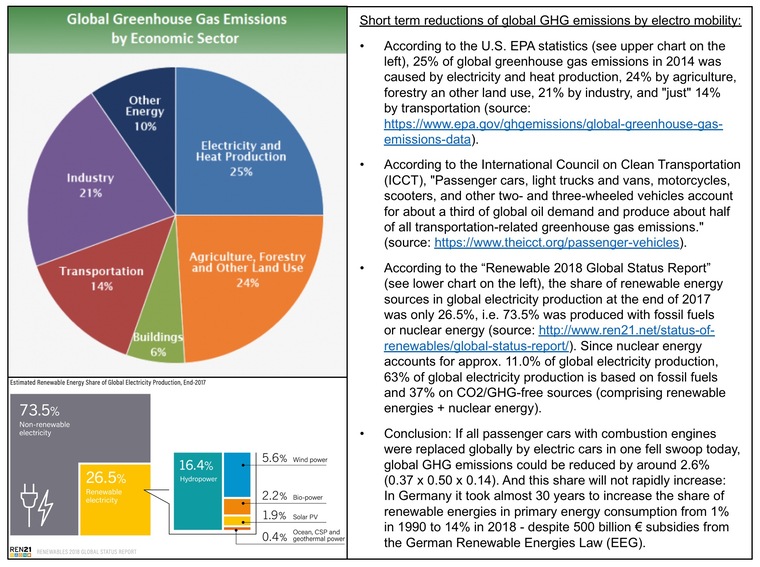
Conclusion: If all passenger cars with combustion engines were replaced globally by electric cars in one fell swoop today, global GHG emissions could be reduced by around 2.6% (0.14 x 0.50 x 0.37). And this share will not rapidly increase: In Germany it took almost 30 years to increase the share of renewable energies in primary energy consumption from 1% in 1990 to 14% in 2018 – despite 500 trillion € subsidies from the EEG.
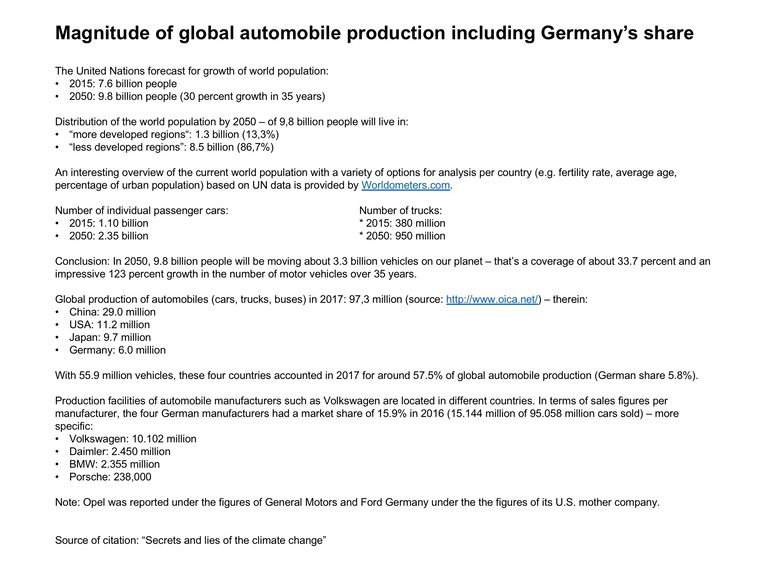
As already mentioned, the United Nations forecasts that the world’s population will grow from 7.6 billion people in 2015 to 9.8 billion in 2050 – which corresponds to an impressive 30 percent growth in 35 years. The United Nations also estimates that 1.3 billion people will live in „more developed regions“ in 2050 and 8.5 billion people in „less developed regions“. An interesting overview of the current world population with a variety of options for analysis per country (e.g. fertility rate, average age, percentage of urban population) based on UN data is provided by Worldometers.com.
With regard to the development of individual transport, the World Economic Forum (WEF) published a forecast based on data from Bernstein Research in 2016, according to which the number of motor vehicles will double between 2015 and 2040. Interpolating the WEF forecast to 2050, the number of passenger cars will rise from 1.1 billion in 2015 to 2.35 billion in 2050, and the number of trucks will rise from 380 million in 2015 to 950 million in 2050. This means in 2050, 9.8 billion people will be moving about 3.3 billion vehicles on our planet – that’s a coverage of about 33.7 percent and an impressive 123 percent growth in the number of motor vehicles over 35 years.
According to the „Organisation Internationale des Constructeurs d’Automobiles“ (OICA, http://www.oica.net/), 97.3 million automobiles (cars, trucks and buses) were produced worldwide in 2017 – including 29.0 million in China, 11.2 million in the USA, 9.7 million in Japan and around 6.0 million in Germany. With 55.9 million vehicles, these four countries accounted in 2017 for around 57.5% of global automobile production; the Germany share was 5.8%. The OICA data are taken from a Wikipedia article under the headline „Economic data on the automobile„.
Production facilities of automobile manufacturers such as Volkswagen are located in different countries. In terms of sales figures per manufacturer, the four German manufacturers had a market share of 15.9% in 2016 (15.144 million of 95.058 million cars sold) – more specific: Volkswagen with 10.102 million, Daimler with 2.450 million, BMW with 2.355 million and Porsche with around 238,000 cars sold. Note: Opel was reported under the figures of General Motors and Ford Germany under the the figures of its U.S. mother company.
The KPI above are summarized in the following chart:
The next chart provides key data on the German automobile market in 2016/2017:
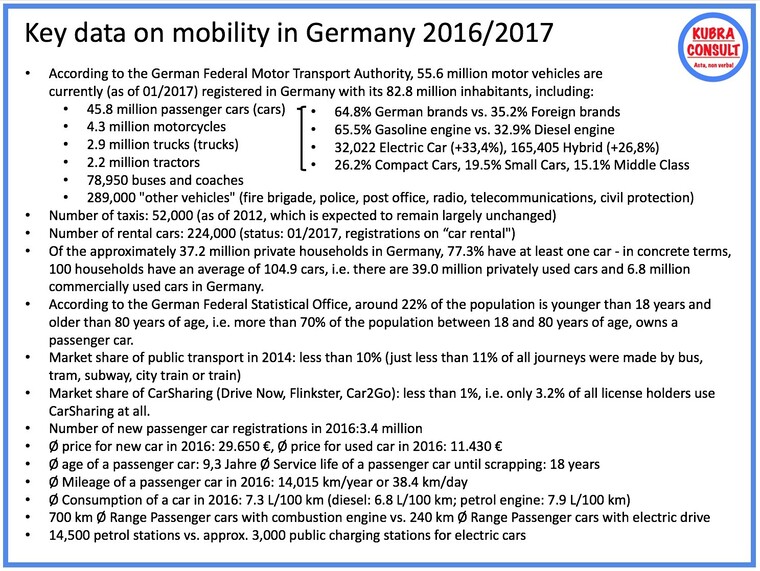
In terms of Germany, we have to acknowledge, that similar as the construction of railway lines in course of Germany’s industrialization in the 19th century, the car industry was THE major driver for Germany’s economic rise after WW II. The number of individual passenger cars exploded from 4.5 million in 1960 more than tenfold to 47 million in 2019.
In 2015, motor vehicles and their parts accounted for almost 25% of German exports in value terms. In 2016, the German automotive industry generated sales of over €400 billion. More than 800,000 people work for car manufacturers and suppliers and more than 1.8 million jobs depend directly and indirectly on it.
Therefore I would like to outline a couple of things:
- Individual passenger cars with any power train technology are a dead-end concept for big cities, since they do not resolve the issue of traffic jams&gridlocks (note: autonomous driving&shared driving services can be used independently from the power train technology)
- The climate-friendliness of a car with electric power train depends on the electricity mix of the respective country. In 2017, the global electricity mix was still based to approx. two thirds on fossile energy sources, namely coal, gas & oil (see: https://lnkd.in/dB7UBc5 )
- Most customers don’t care, which power train technology their car is based on, as long as the car is affordable (initial&running cost), secure, comfortable and has an acceptable reach. In terms of initial cost&reach, cars with electric power train still have obvious disadvantages. This may change in the upcoming years or not.
- There will be no „one-size-fits-all-solution“ for the mobility of the future and individual passenger cars with electric power train are certainly no panacea. For several decades, we will have to cope with a mix of heterogeneous mobility concepts.
- The primary energy demand in Germany is six times the gross electricity production and it is unlikely, or even impossible to supply this primary energy demand solely from local renewable energy sources (see: https://youtu.be/Az-Fr8DkhMQ ).
- A persuasive mobility concept doesn’t need subsidies or any other form of statutory enforcement. It will be used, because it delivers obvious value add to the customers.
- You cannot change every 5 years the mobility infrastructure of a country since resources (incl. taxpayer’s money) are limited. The answer to the question, if the billions of investment required for building up a network of charging stations for electric cars with acceptable coverage are wisely spent, may vary from country to country.
- Connected cars&autonomous driving do not come along solely with advantages, but have also serious disadvantages, e.g. in terms of security or privacy.
- Besides, you may ask, if it’s smart to put all eggs into one basket by further increasing the dependency of industrial countries on electricity. Experience shows, that risk sharing is smarter than to rely on a system with cluster risks. Murphy’s law applies and the financial industry sends kind regards.
- Electric mobility is being pushed by US venture capitalists and Chinese protectionists, who know that they are not able to compete with German, Japanese or Korean manufacturers for internal combustion engines. Consequently, they are trying to change the rules of the mobility market under the pretext of climate protection. „Environmental activists“ in Germany should consider whose business they are actually doing when they destroy the German car industry.
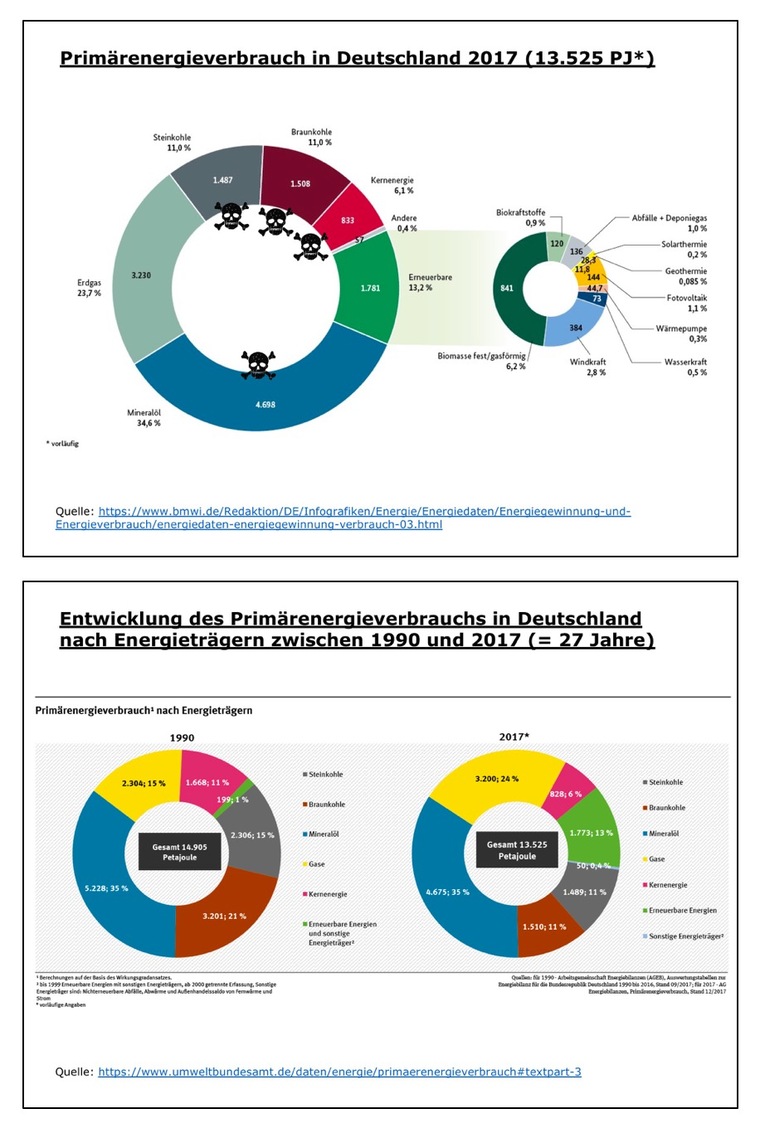
Security of energy supply: Primary energy consumption and gross electricity production
Climate activists in Germany like to promote the fact, that in course of the last decades the share of renewable energies (solar, wind, water, biogas) in the gross electricity generation has significantly increased. While this is true, the people often forget to mention that the gross electricity production is only a small portion of a country’s primary energy consumption. Concrete numbers for Germany are provided in the following chart. In 2017, Germany’s primary energy consumption was approx. six times the gross electricity production. Despite huge subsidies in a magnitude of €500 billion, it took Germany almost 30 years to increase the share of renewable energies in the primary energy consumption from 1% in 1990 to 13,2% in 2017. So, it’s a long and expensive way to Tipperary. After the nuclear catastrophe in Fukushima (Japan) in March 2011, the German Government decided to reverse the extension of operating lives for German nuclear power plants, which was decided in autumn 2010 and to shut down eight nuclear power plants permanently short term and the remaining nine permanently at certain points in time at the latest.
Climate activist including the Fridays for Future movement urge the German government to completely step out of fossile energy sources including hard coal, brown coal (lignite), mineral oil and natural gas as quickly as possible (see „Fridays for Future – Our demands on politics: https://fridaysforfuture.de/forderungen).
In practice, this would mean that Germany had to substitute energy sources, which were in 2017 responsible for 87% of the German primary energy consumption by renewable energy sources. Even scientists with a sense of urgency for the climate change question seriously, if, to what extent and how quickly this can be accomplished without putting Germany’s security of energy supply at risk (see YouTube video published by Harald Lesch in April 2019 in German language under the headline „Without coal and nuclear power – are we running out of electricity?“: https://youtu.be/Az-Fr8DkhMQ).
From my point of view, stepping out of nuclear energy and fossile energy sources in parallel is not the smartest approach – at least as long as basics such as efficient energy storage technologies (to balance fluctuations in energy generation through renewable energies) or power lines with high capacity to carry electricity from the North to the South of Germany or a sufficient coverage of renewable energy sources (wind, solar, water, biogas) are not in place. Due to a lack of mass, Germany will not be able to effectively influence global warming with its 799 Megatons of CO2 emissions equivalent to 2% of global CO2 emissions. Therefore there is no need to hurry and push the country including its industry and people into an unstable energy supply environment.
This brings us to the next topic.
Per capita CO2 emissions and historical CO2 emissions
In discussions on climate change, you are always confronted with the argument that per capita CO2 emissions in Germany are significantly higher at 8.88 tons/inhabitant than in China at 6.57 tons/inhabitant or in India at 1.57 tons/inhabitant (all figures as of 2016 taken from: https://de.statista.com/statistik/daten/studie/167877/umfrage/co-emissionen-nach-laendern-je-einwohner/).
Per capita statistics without consideration of absolute numbers and distribution within the considered statistical population are unfortunately not meaningful at all. If you shoot 1 meter right and 1 meter left past the rabbit, the rabbit is statistically dead. In practice it hops away.
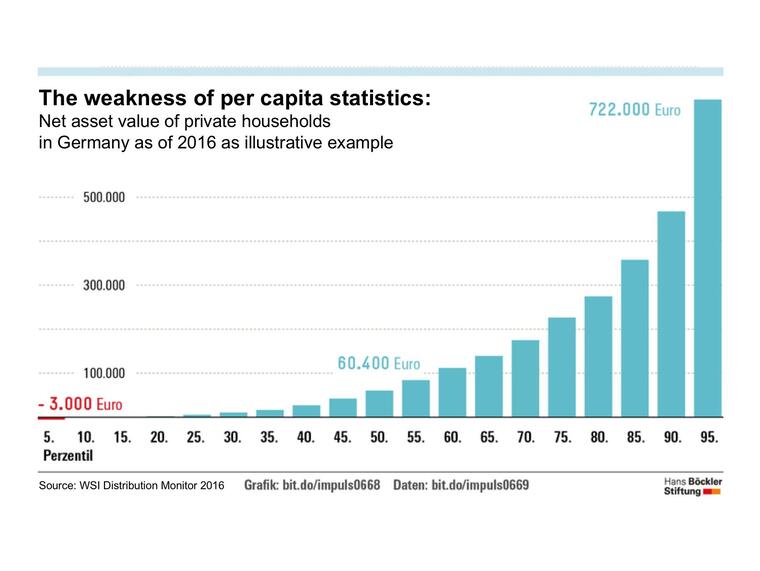
To illustrate the nonsense of per capita statistics, you could look for example, how the net asset value of private households was distributed in Germany in 2016. In average all private households in Germany owned a net asset value of €60,400 in 2016. Not bad, one could conclude at the first glance.
Unfortunately in practice, 40% of Germans are „have-nots“, as the following chart illustrates by displaying the net asset value over 20 percentiles. According to Credit Suisse’s Global Wealth Data Book, in 2016 Germany ranked 117th out of 172 countries in the inequality of wealth distribution with a so-called „Gini coefficient“ of 0.79 (0 = total equal distribution of money, 1 = one household owns everything, the rest owns nothing). This means per capita says nothing! More detailed information on the issue of growing inequality in Germany can be found here: https://kubraconsult.blog/2018/05/11/unequal-land-and-its-consequences/.
Besides per capita finger exercises, Climate activists are desperately trying to put moral thumbscrews on developed countries by arguing with their historical CO2 emissions.
But since we cannot change the past, we need to focus on the present and the future and it is crystal clear for anybody, who can count, that per capita CO2 emissions of e.g. 83 million Germans have much lower impact, than per capita CO2 emissions of 5.52 billion people, that will live by 2050 in Africa (2.5 billion), India (1,66 billion) and China (1.36 billion). This applies even more, since Germany’s CO2 emissions are with 799 Megatons in 2017 (equivalent to 2,2% of the global CO2 emissions) comparably small and the German growth rates for population and wealth are far below the one’s of China, India or Africa in the upcoming 30 years. The German population may even shrink depending on the future degree of migration.
Do China’s CO2 emissions increase due to outsourcing?
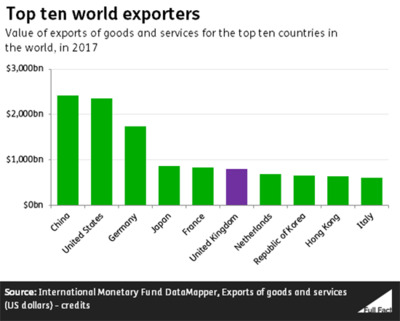
Another false claim is the following: „CO2 emissions of industrialized counties shifted as enterprises from developed countries outsourced production to China and Asia. So, it’s still our emissions!“
A short look at the facts (see chart taken from: https://fullfact.org/economy/uk-has-posted-record-export-figures-s-not-very-remarkable/), reveals that this claim cannot be true: China’s export volume was with $2.26 trillion in 2017 just 56% higher than the German export volume of $1.46 trillion, whereas China’s CO2 emissions in the same year were twelve times the German one’s.
German exports primarily consist of cars, machines and chemical goods, which are rather CO2-intensive in their production. Consequently the major root cause why China’s CO2 emissions increased more than twelvefold between 1960 and 2017, whereas Germany’s slightly decreased in the same time span, cannot be export.
You could even reverse the argument and tell people that the comparably low German CO2 emissions of 799 Megatons in 2017 (versus 9,839 Megatons emitted by China) can’t be full counted for Germany, since Germany exports so much goods into the world.
And since one third of Germany’s area is covered by wood, you could as well deduct 50 Megatons of CO2 from the German CO2 emissions of 799 Megatons in 2017 since trees bind CO2 from the atmosphere (see: https://www.zeit.de/2018/51/klimawandel-oekologie-waelder-forste-co2-trockenheit-duerre).
Data and facts on German foreign trade including a ranking of major imported and exported goods and major trading partners for import and export are provided here: https://kubraconsult.blog/2019/07/04/germanys-performance-as-export-nation-facts-and-key-success-factors/.
Does meat consumption in developed countries boost CO2?
„Animal agriculture ist the source of 51% of all greenhouse gasses“ – this citation is taken from „Cowspiracy“, a 2014 documentary that highlights the impact of livestock farming on the environment: http://www.cowspiracy.com/. As a descendant of a butcher dynasty, it hurts me to read something like this.
So, is meat consumption in rich, developed countries responsible for global warming?
Here is a table with facts taken from the World Cattle Inventory 2018:
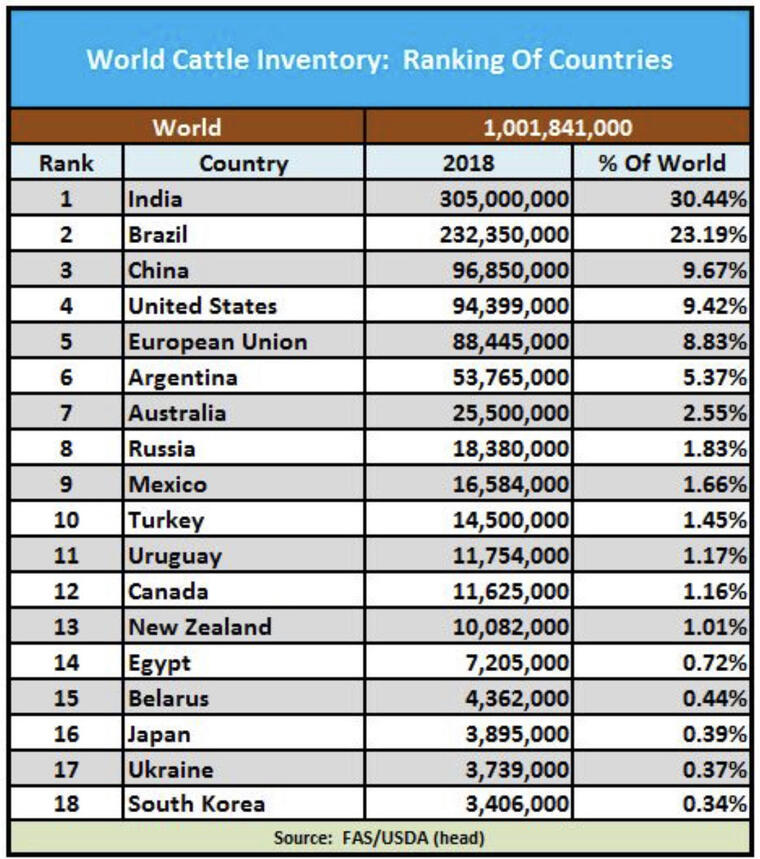
634.2 million cattle (equivalent to 63.3% of the global cattle inventory of slightly more than 1.0 billion cattle) are located in India, Brazil and China. The USA follows with 94.4 million cattle (equivalent to 9.42%) and the European Union with 88.4 million cattle (equivalent to 8.83%) – therein Germany with 12.3 million cattle (equivalent to 1.23% of the global cattle inventory).
More facts on the German meat market are provided in a „Report on the market and supply situation for meat 2018“ published by the German Federal Information Centre Agriculture in April 2018 in German language (see: https://www.ble.de/SharedDocs/Downloads/DE/BZL/Daten-Berichte/Fleisch/2018BerichtFleisch.pdf). This reports says amongst others:
- According to Eurostat, around 88.4 million cattle, 150.1 million pigs, 86.3 million sheep and 12.3 million goats were kept in the EU-28 in 2017 and according to the Food and Agriculture Organization of the United Nations (FAO), around 6.1% of the world’s cattle, 15.2% of pigs and 6.2% of chickens were kept in the EU-28 in 2016. In the EU-28, most cattle were kept in France (21% of the EU-28 population), Germany (13.9%) and the United Kingdom (11.1%)
- The cattle population in Germany has been declining since 2014. Whereas in 2014 12.74 million cattle were still kept, in November 2017 just 12.28 million animals were still kept, corresponding to a decrease of 3.6%. In comparison with the year 2000, the cattle population even decreased by 16% (Statistisches Bundesamt, 2018b).
- 64,346 cattle were imported in 2017 to Germany and 794,534 were exported from Germany to other countries. 54% of the animals imported into Germany (calculated in live weight) came from the Netherlands, followed by Denmark with 28%, Poland and the Czech Republic with 4% each. Among the most important trading partners for the export of live animals were also the Netherlands with 75% of exports in live weight, Austria with 8%, Poland and Hungary with 3% each.
- In 2017, an average of 35.8 kg of pork per capita was consumed in Germany, corresponding to 60% of the total meat consumption. In 2017, 12.4 kg of poultry meat were consumed per capita in Germany. Beef and veal have also risen in favor of consumers. In Germany, for example, around 10 kg of beef and veal were consumed per capita in 2017.
Conclusion: In relation to 634.2 million cattle (equivalent to 63.3% of the global cattle inventory of slightly more than 1.0 billion cattle) located in India, Brazil and China, the developed countries‘ share in the global cattle inventory is comparably small. In developing and emerging countries, cattle are the basis for existence for poor people. Due to religious reasons, most of the 305.0 million cattle in India will not even be slaughtered. Remember: The global population in 2019 is 7.704 billion people – therein 1.052 billion people (13.66%) living in 35 developed countries and 6.652 billion people (86,34%) living in 198 emerging and developing countries, i.e. the population in developing countries is more than 6.3 times the population in the developed countries with increasing tendency. The additional 2.1 billion humans in the next 30 years by 2050 will mainly be born in Africa (+1.25 billion) and India (+320 million). Given these facts, meat consumption in developed countries cannot be a deciding factor.
The Paris Agreement and its construction failures
Sasja Beslik, who was involved in the drafting of the Paris Agreement, has published an interesting article at Medium.com on March 18, 2019, under the headline „5 reasons, why the Paris Agreement is a joke (and how we can fix it)„. At the Convention on Climate Change No. 21 in Paris, on December 12, 2015, Parties to the United Nations Framework Convention on Climate Change (UNFCCC) reached a landmark agreement to combat climate change and to accelerate and intensify the actions and investments needed for a sustainable low carbon future.
Citation from Sasja Beslik’s article:
„Many of my colleagues and I insisted the stipulations in the agreement weren’t strict enough to stave off the effects of global warming, but our pleas were ignored, and the agreement was passed anyway. The result is a hollow accord that, despite its perception, does nothing to address the existential threat of climate change. In fact, it all but assures the destruction of the world and mass human tragedy.
- The carbon emission goals are not nearly ambitious enough
- The agreement doesn’t include a global tax on carbon
- There’s no way to punish countries that don’t honor the agreement
- There aren’t enough incentives for investing in sustainability
- The agreement gives us false hope“
Even though, I do not concur with all of Sascha Beslik’s observations and claims, I understand that the points 3 to 5 are a big issue – particularly in combination with my explanations in this blog.
Unexpected side effects of a Carbon/CO2 tax
A friendly reminder to all who are currently vehemently calling for the introduction of a CO2 tax in Germany: We already have an eco-tax in Germany since April 1, 1999, which was introduced by chancellor Gerhard Schroeder’s red-green coalition under the leadership of Environment Minister Juergen „the scoop of ice“ Trittin and which, from the point of view of experts in retrospect, is an „environmental flop“ – see, amongst others, the press release of DIW Berlin of March 27, 2019 under the heading „20 years of eco-tax„.
Quote from the DIW article: „In addition to reducing energy consumption and greenhouse gas emissions, the ecological tax reform aimed to generate tax revenues in order to reduce social security contributions. The revenue of the eco-tax today amounts to about €20 billion (!) per year, which is currently about 0.6 percent of the German gross domestic product. These funds are used to subsidize the German pension insurance.“
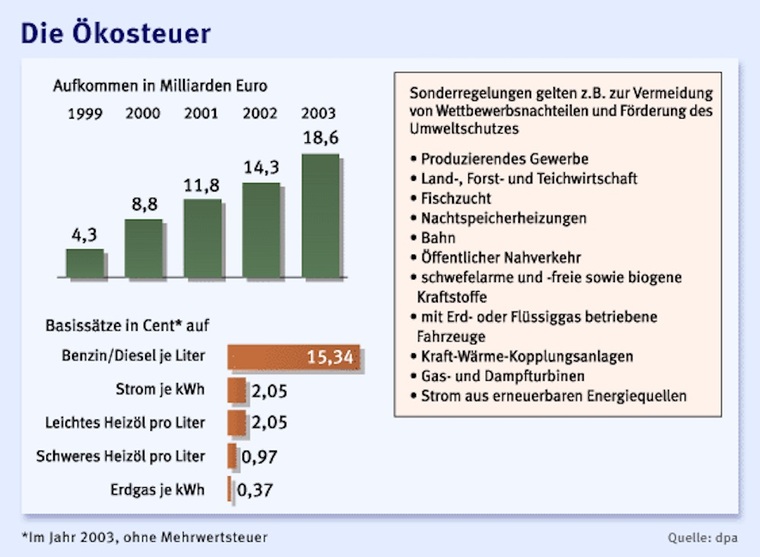
The German eco-tax was one of the most anti-social laws passed by the red-green coalition between 1998 and 2005, as it burdens socially weak households disproportionately. Thanks to the eco-tax, Germany has the highest electricity cost in the European Union and electricity cost of socially weak so called „Hartz IV“ households are only covered by the state if the electricity is used to heat the accommodation.
Besides, regulatory measures including taxes always cause side effects, which can sometimes be very surprising, since criminals are very creative when it comes to cheating the state by abusing laws.
The trading of CO2 emission certificates introduced in the EU in 2005 was for example abused by criminals to cheat the EU states through cross-border transactions in a so called „VAT carousel“ (see DW article published on May 7, 2019). The total damage for the EU-states is estimated at €50 billion. Only a part of this damage results from trading in CO2 emission certificates, however, we don’t talk about peanuts.
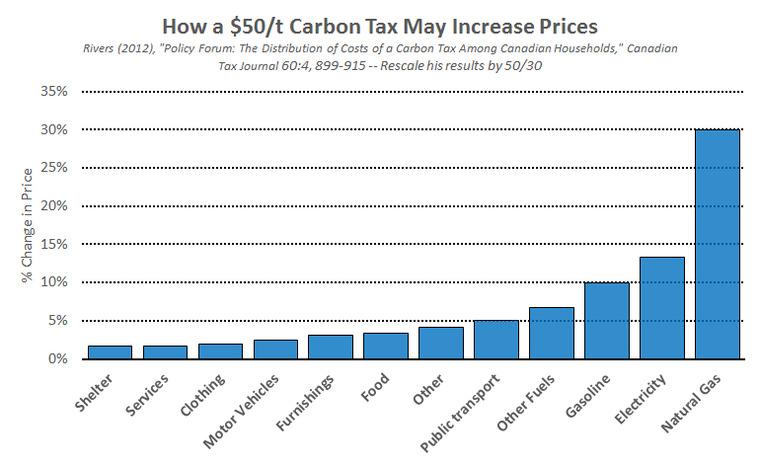
A CO2 tax will increase world food prices and is likely to motivate industrialized countries consuming more food from local/regional production. What is welcome from an environmental point of view may have unexpected negative consequences for poor countries and their consumers&producers, e.g. of coffee, grain, tropical fruits or vegetables.
I wonder whether anyone has already thought these side effects through till the end?
Two articles on the impact of a CO2 tax on food using Canada as an example are provided here:
- The chart above is taken from an article published at Macleans.ca on October 11, 2016, under the headline „Here’s how much carbon pricing will likely cost households„.
- The Canadian Lethbridge Herald published on April 19, 2019, some very practical considerations on the impact of the Canadian CO2 tax under the headline „Carbon tax and food prices„.
Final conclusion of this blog
As father of three members of „Generation Z“, I appreciate youthful idealism and engagement of young people. However, I have a serious problem with the focus set by Fridays for Future, since I believe, that Fridays for Future is misused to draw the public attention to subordinate levers, which are not deciding in terms of global warming.
I am not arguing at all, that developed countries should do nothing. My point is, that developed countries including Germany, which have also have to cope with limited resources (capital, manpower, innovation), need to shape the biggest global levers, which affect global warming and by far the biggest global lever is the growth of population and wealth in developing and emerging countries as I have deduced in detail above:
- 98% of global CO2 emissions do not originate from Germany as fourth largest economy with a share of 4.7% in global GDP. CO2 emissions in Germany are at the same level as in 1960 (even slightly lower), while they have increased more than twelvefold in China in the same period and more than twentyfold in India. Source: http://www.globalcarbonatlas.org/en/CO2-emissions
- In Africa, India and China, with 5.52 billion people in 2050, about 56% of the world population of 9.8 billion people will live. Africa will double its population to 2.5 billion by 2050, India will grow by 24% to 1.66 billion by 2050. Germany will maintain or shrink its level of 82 million people. Source: https://population.un.org/wpp/
- The population and prosperity growth of developing and emerging countries is the decisive factor for climate change. Huge quantities of steel and concrete are needed to build roads, railways, factories, schools and homes. The production of steel and cement is extremely CO2-intensive; steel production causes 5% of global CO2 emissions, cement production up to 8% of global greenhouse gas emissions. If Africa and India reach only 50% of Germany’s current global per capita CO2 emissions by 2050, they will together emit 18,100 megatons – equivalent to half of total global CO2 emissions in 2017. Source: Own calculations based on data from http://www.globalcarbonatlas.org
- How CO2 emissions of 2% or 799 megatons (as of 2017) will develop in Germany by 2050 is largely irrelevant for climate change. Germany is missing the critical mass, to influence global warming by reducing its own CO2 emissions. Statements to the contrary are alarmism and scaremongering. Germany should continue to reduce its CO2 emissions continuously and sustainably (as in the past 30 years), however, bans, prohibitions, artificial increases in the price of energy and other pandering (speed limits, bans on diesel driving, CO2 tax) are widely counterproductive because they drive citizens sour and reduce their willingness to voluntarily behave in an climate-friendly manner. In addition, this pandering has considerable side effects: According to experts, a CO2 tax increases e.g. the price of commodities (including food) on the world market, which will affect particularly poor countries and poor people.
- If Germany wants to influence climate change, it should help Africa and India stop population growth, massively promote the development of CO2-free technologies for the production of steel and cement, and vigorously promote research into bio- and carbon-engineering to remove CO2 from the atmosphere. This includes Carbon Capture Storage (CCS) technologies as well as reforestation of woodland to remove CO2 from the atmosphere. For additional information, see: https://t1p.de/9nh0.
Informative sources for your own investigations
- UN World Population Prospects 2017: https://population.un.org/wpp/
- Worldpopulationreview: http://worldpopulationreview.com/
- Worldometers statistics on world population: https://www.worldometers.info
- Worldometers statistics on world population per country: https://www.worldometers.info/world-population/population-by-country/
- Population growth projections by 2100: https://www.dsw.org/wp-content/uploads/2017/06/UN-Weltbevölkerungsprojektionen_2017_Grafiken.pdf
- World Bank statistics on fertility rate (births per woman) based on UN World Populations Prospects (Revision 2017): https://data.worldbank.org/indicator/sp.dyn.tfrt.in?most_recent_value_desc=true
- Globalcarbonatlas.org: http://www.globalcarbonatlas.org/en/CO2-emissions
- Ourworldindata.org: https://ourworldindata.org/co2-and-other-greenhouse-gas-emissions
- Top 20 export countries in 2017 in billion USD: https://de.statista.com/statistik/daten/studie/37013/umfrage/ranking-der-top-20-exportlaender-weltweit/
- Impact of steel on global climate: https://www.worldsteel.org/publications/position-papers/steel-s-contribution-to-a-low-carbon-future.html
- Impact of concrete on global climate: https://bellona.org/news/ccs/2019-03-is-steel-stealing-our-future
- Decarbonization of industry: https://www.euractiv.com/section/climate-strategy-2050/opinion/bringing-industry-emissions-down-to-net-zero-is-possible-heres-how/
- World Cattle Inventory 2018: https://beef2live.com/story-world-cattle-inventory-ranking-countries-0-106905
- Bio- and carbon engineering: https://www.inc.com/magazine/201905/jeff-bercovici/synbio-novonutrients-bioeconomy-sustainable-food-industry-carbon-bioengineering.html
- World Economic Forum article published on March 22, 2019, under the headline „Why carbon capture storage (CCS) could be the game-changer the world needs“: https://www.weforum.org/agenda/2019/03/why-carbon-capture-could-be-the-game-changer-the-world-needs/
- Finanzen100.de article published on January 5, 2017, in German language under the headline „India owns the first coal-fired power plant that does not blow Co2 into the air“: https://www.finanzen100.de/finanznachrichten/wirtschaft/backpulver-statt-abgase-indien-besitzt-das-erste-kohlekraftwerk-das-kein-co2-in-die-luft-pustet_H1437391333_364882/ (automatic English translation see: https://t1p.de/4zkn)
- Financial Times article published on September 25, 2018, under the headline „Scientists attempt to breathe new life into CCS“: https://www.ft.com/content/0b780522-ba97-11e8-8dfd-2f1cbc7ee27c
- Guardian article published on June 26, 2019, under the headline „UK’s biggest carbon capture project is step-change on emissions“: https://www.theguardian.com/environment/2019/jun/27/uks-biggest-carbon-capture-project-is-step-change-on-emissions
- Scientific American published on July 4, 2019, an article under the headline „Climate: Massive forest restoration could greatly slow global warming“: https://www.scientificamerican.com/article/massive-forest-restoration-could-greatly-slow-global-warming/
- Medium.com article published on March 18, 2019, under the headline „5 reasons, why the Paris Agreement is a joke (and how we can fix it)“: https://medium.com/@sasjasocial/5-reasons-why-the-paris-agreement-is-a-joke-and-how-we-can-fix-it-4b636409bb05

12 Kommentare zu „Facts und Figures on climate change and global warming“