The public discussion on the future of mobility is often dominated by ideological, almost pseudo-religious disputes between the advocates of electric vehicles (EV) and the advocates of conventional cars with internal combustion engines (ICE). Unfortunately, the reduction of this important discussion to this narrow contrast is far too short-sighted and leads us in a totally wrong direction.
With regard to the future of mobility, we need to consider the global impact of mobility offerings&technologies over their entire lifecycle including sourcing, production, utilization and disposal. In addition, the perspective must go far beyond technology and include economic, environmental and societal aspects and related side-effects (such as: would people prefer to live in rural areas, if they were enabled to work from home or drive to an urban office quickly and without traffic jams).
Finally, each mobility concept requires a certain infrastructure, that needs to be build up and maintained, which is an important cost factor: gas stations for cars with combustion engines, charging stations for electric vehicles, roads, highways, bridges and parking space for both, railway lines and train stations for trains, tunnels, railway lines and subway stations for metros and so on.
Two complementary blogs written in German language comprising a broad variety of facts are provided here:
- „Electric cars – pros and cons“ published on October 13, 2019: https://t1p.de/941g (automatic English translation see: https://t1p.de/4wo9)
- „General speed limit on German motorways – facts and figures“ published on October 18, 2019: https://t1p.de/hlzp (automatic English translation see: https://t1p.de/z59c)
So, let’s get down to the details.
The design of future mobility concepts needs to be based on the analysis of global mega trends, such as urbanization, growing awareness for ecology, aging of society in developed countries, or the rapidly increasing population and wealth in developing and emerging countries as mission critical lever.
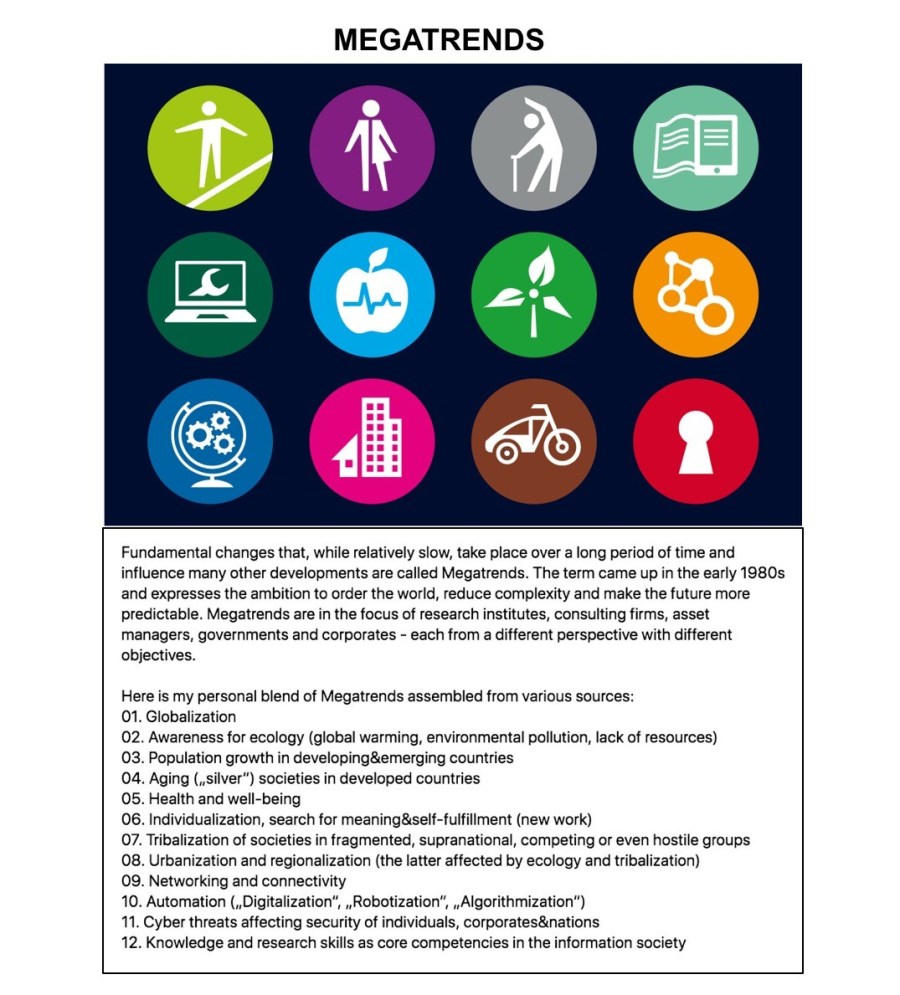

Due to the outstanding importance of „rapidly increasing population and wealth in developing and emerging countries“ for future mobility, I would like to explain the impact of this mega trend at first in an excursus.
START OF EXCURSUS ON POPULATION&WEALTH GROWTH
According to UN forecasts, the world population will grow from 7.7 billion in 2019 to 9.8 billion in 2050. The increase by 2.1 billion comes mainly from Africa (+1.25 billion people) and India (+320 million people). Of the 9.8 billion people in 2050, 87 percent (8.5 billion) are expected to live in developing and emerging countries – including 2.5 billion in Africa, 1.66 billion in India and 1.36 billion in China. These three countries/regions will contribute together in 2050 more than 56 percent to the global population of 9.8 billion people.
The following map is taken from a Washington Post article published on May 7, 2013, under the headline „More than half of humanity lives within this circle“: https://www.washingtonpost.com/news/worldviews/wp/2013/05/07/map-more-than-half-of-humanity-lives-within-this-circle/.
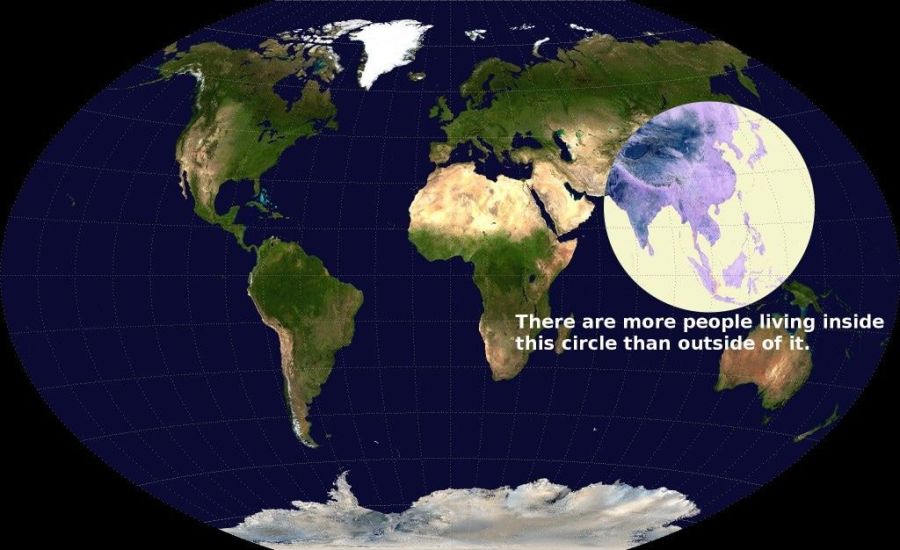
Citation: „In yet another illustration of China’s and India’s enormous populations, Reddit surfaced the attached population map, which claims more than half the world’s people live in 2013 within a circle superimposed over a section of Asia. Amazingly, the numbers check out.“
In following list of 19 Asian countries within the circle, I included the most recent 2019 numbers as provided by wordpopulationreview.com on June 14, 2019.
In 2019, 3,913,929,100 of 7,714,576,923 people on Planet Earth (= 50,74%) do live in the following 19 Asian countries:
- China: 1,419,834,371
- India: 1,368,069,021
- Indonesia: 269,410,592
- Bangladesh: 167,987,609
- Japan: 126,869,568
- Philippines: 108,033,265
- Vietnam: 97,385,946
- Thailand: 69,300,161
- Myanmar: 54,314,531
- South Korea: 51,331,233
- Malaysia: 32,434,937
- Nepal: 29,927,430
- North Korea: 25,722,111
- Taiwan: 23,755,390
- Sri Lanka: 21,015,667
- Cambodia: 16,471,871
- Laos: 7,059,730
- Mongolia: 3,164,189
- Bhutan: 825,811
Note: The circle also includes parts of Russia&Pakistan, which aren’t included in the list above and excludes a bit of Northwest China.
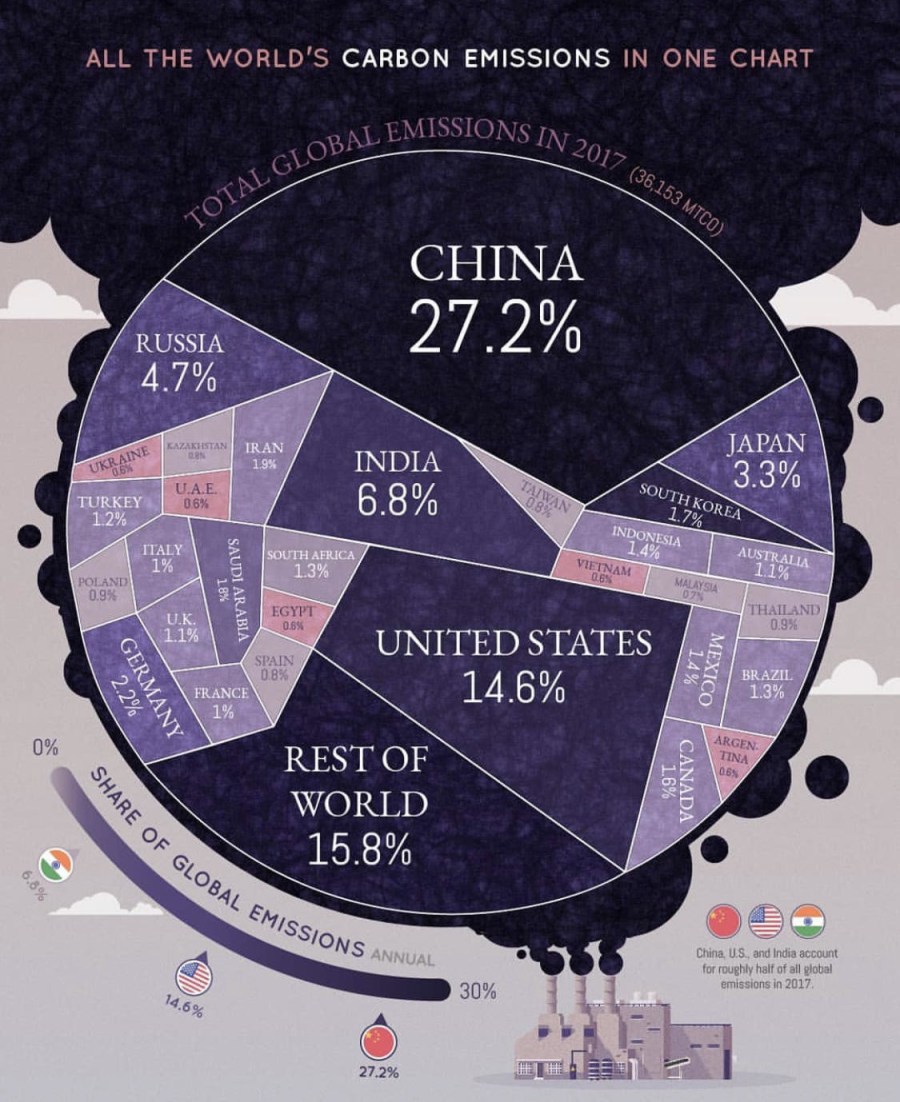
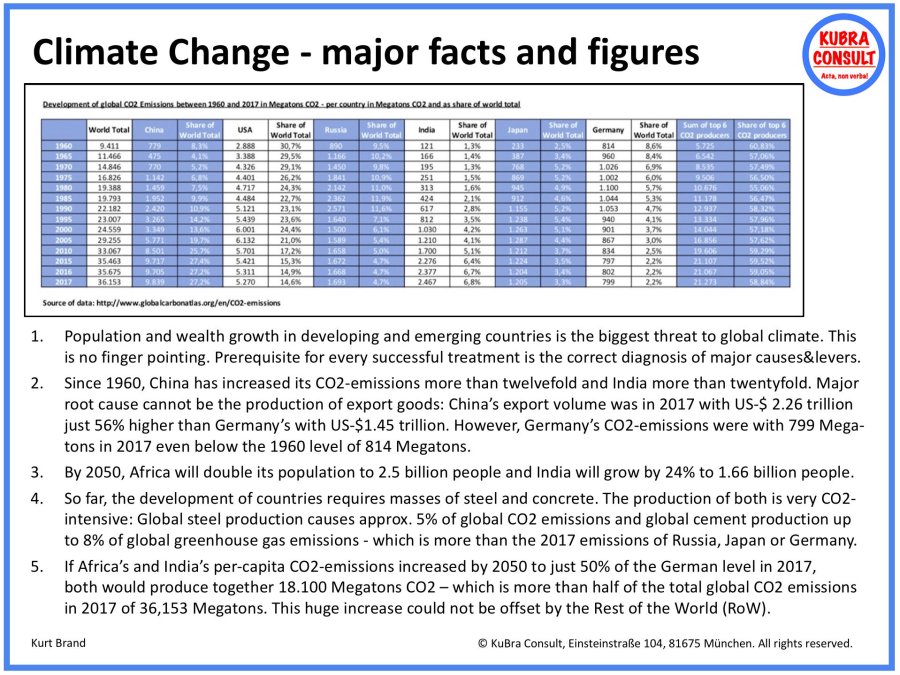
Particularly the combination of high population and wealth growth has huge impact on resource consumption as well as on CO2/GHG (Greenhouse Gas) emissions. As the following list illustrates, Chinas has e.g. increased its CO2 emissions more than twelvefold between 1960 and 2017 and India even more than twentyfold, so that China is today the biggest CO2 emitter and India the third biggest (see: http://globalcarbonatlas.org):
1. China has increased its CO2 emissions by factor > 12 (!):
1960: 779 megatons = 8.3% of global CO2 emissions
2017: 9,839 megatons = 27.2% of global CO2 emissions
2. The USA have increased their CO2 emissions by factor 1.8:
1960: 2,888 megatons = 30.7% of global CO2 emissions
2017: 5,270 megatons = 14.6% of global CO2 emissions
3. Russia has increased its CO2 emissions by factor 1.9:
1960: 890 megatons = 9.5% of global CO2 emissions
2017: 1,693 megatons = 4.7% of global CO2 emissions
4. India has increased its CO2 emissions by factor > 20(!):
1960: 121 megatons = 1.3% of global CO2 emissions
2017: 2,467 megatons = 6.8% of global CO2 emissions
5. Japan has increased its CO2 emissions by factor 5.17:
1960: 233 megatons = 2.5% of global CO2 emissions
2017: 1,205 megatons = 3.3% of global CO2 emissions
6. Germany was the only country amongst the top 6 CO2 emitters, which was able to (slightly) decrease its CO2 emissions:
1960: 814 megatons = 8.6% of global CO2 emissions
2017: 799 megatons = 2.2% of global CO2 emissions
Note: The decrease of CO2 emissions in Germany has been influenced by the German reunification and the subsequent shutdown of many industrial sites in East Germany.
The following chart visualizes the global CO2 emissions as of 2017 along major CO2 emitters:

The next chart illustrates the impact of economic growth rates on the development of a country’s Gross Domestic Product (GDP). The chart is taken from an article published on September 26, 2016, by the Mercatus Center of the George Mason University in Arlington/USA under the headline „At 2 Percent Growth Rate, It Would Take 35 Years to Double the Size of the US Economy“ (source: https://www.mercatus.org/publications/2-percent-growth-35-years-double-size-US-economy):

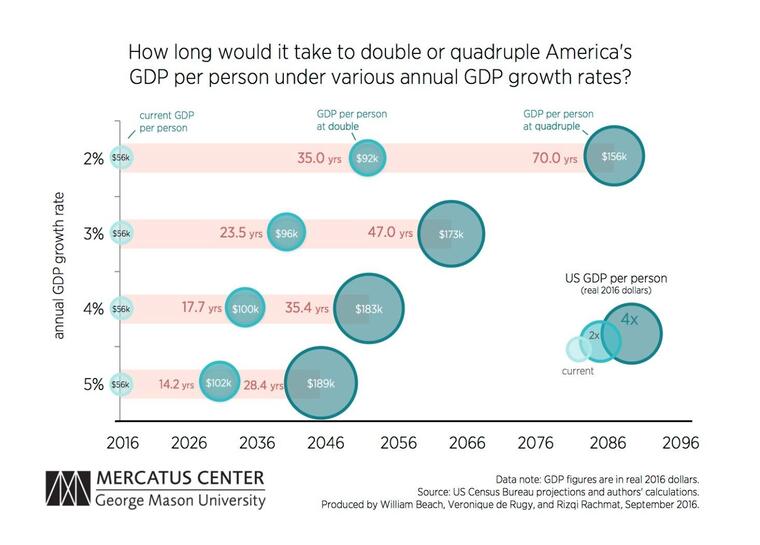
The absolute $ amounts mentioned in the chart above are U.S. specific, however, the following overall logic applies in general for all countries:
- At 2% annual growth rate, a country’s GDP doubles within 35 years and quadruples within 70 years
- At 3% annual growth rate, a country’s GDP doubles within 23.5 years and quadruples within 47 years.
- At 4% annual growth rate, a country’s GDP doubles within 17.7 years and quadruples within 35.4 years.
- At 5% annual growth rate, a country’s GDP doubles within 14.2 years and quadruples within 28.4 years.
The following comparison of the growth rates of emerging countries, such as China and India with the growth rates of developed countries, such as the USA and Germany, shows an important difference which has already significantly affected global warming in the past 60 years:
- China’s GDP annual growth rate averaged 9.52% from 1989 until 2019, reaching an all time high of 15.40% in the first quarter of 1993 and a record low of 3.80 % in the fourth quarter of 1990 (source: https://tradingeconomics.com/china/gdp-growth-annual)
- India’s GDP annual growth rate averaged 6.21% from 1951 until 2018, reaching an all time high of 11.40% in the first quarter of 2010 and a record low of -5.20% in the fourth quarter of 1979 (source: https://tradingeconomics.com/india/gdp-growth-annual).
- The USA’s GDP Annual Growth Rate averaged 3.20% from 1948 until 2019, reaching an all time high of 13.40% in the fourth quarter of 1950 and a record low of -3.90% in the second quarter of 2009 (source: https://tradingeconomics.com/united-states/gdp-growth-annual).
- Germany’s GDP Annual Growth Rate averaged 2.01% from 1971 until 2018, reaching an all time high of 7.20% in the first quarter of 1973 and a record low of -6.80% in the first quarter of 2009 (source: https://tradingeconomics.com/germany/gdp-growth-annual).
The projections for the development of wealth growth are very clear and show unambiguously that China and India both will outperform the USA as largest global economies in course of the upcoming 30 years by 2050. Japan as third largest global economy today and Germany as fourth largest economy today will continue to grow, however, they will be overtaken by emerging countries such as Indonesia, Brazil, Russia and Mexico and drop from ranks 3 and 4 today to ranks 8 and 9 in 2050.
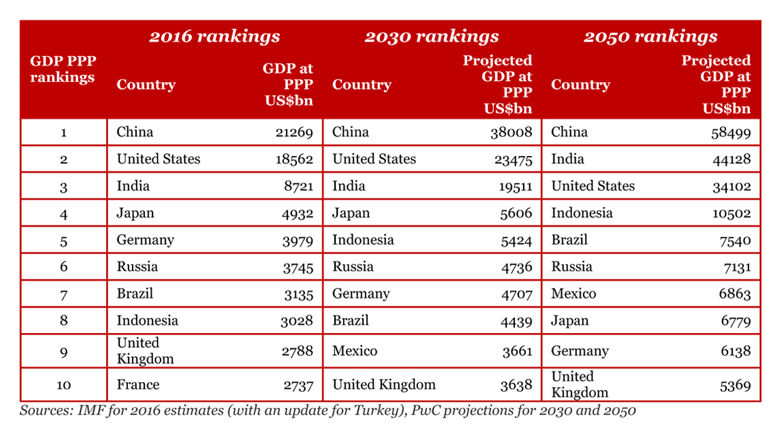
Note: The last chart above is based on Purchasing Power Parity (PPP), which is a way of measuring economic variables in different countries so that irrelevant exchange rate variations do not distort comparisons.
Above average growth of population x above average growth of wealth = problem
The following chart illustrates the worldwide CO2 emissions per country/region against two important dimensions: size of population and CO2 emissions per capita. The data comes from the International Energy Agency (IEA), was published in 2018 and shows the 2016 status. The total CO2 emissions of a country/region are represented through a rectangle. The height of each rectangle reflects the CO2 emissions per capita and the width reflects the population. Countries/regions are sorted by CO2 emissions per capita, from the highest to the lowest.
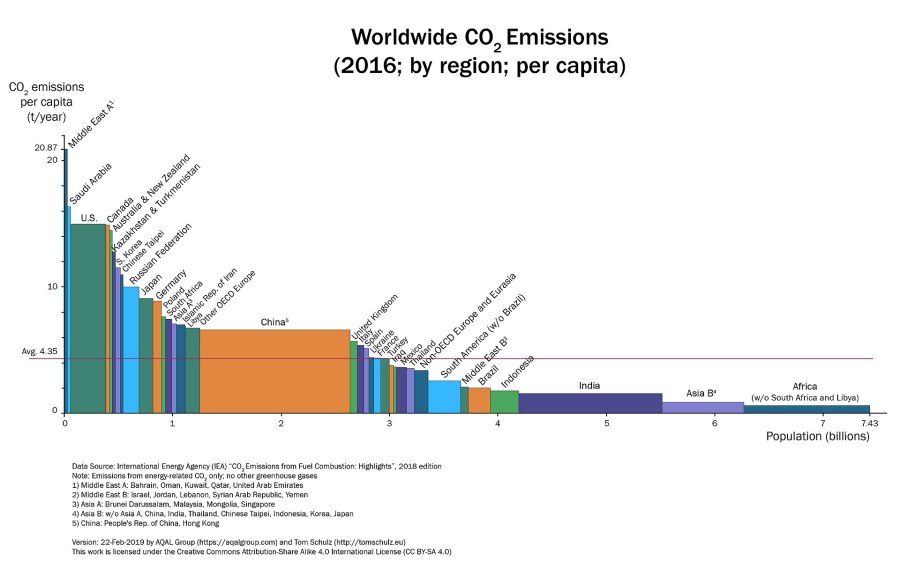

Large population plus high CO2 emissions per capita is the worst combination, which applies today already to the USA and China. Even more deciding is the future growth of population and wealth since it affects the future CO2 emissions. As mentioned, Africa will double its population to 2.5 billion people by 2050 according to UN forecasts. India ranks 2nd with an increase by 320 million to 1.66 billion people by 2050. If the 54 African states reach only 50% of Germany’s per capita emissions of 8.8 tons in 2017 within the next 30 years, as a result of increasing wealth, then 11,000 megatons of CO2 will be emitted by Africa in 2050, which is equivalent to 30% of global CO2 emissions of 36,153 megatons in 2017.
Citation from an interesting WEF video published in April 2019: „China’s rapid economic growth has raised the incomes of huge numbers of its people. In 2000 just 4% of China’s urban households had middle-class incomes – compared to 68% in 2012 (source: McKinsey). By the mid-2020s, 780 million Chinese people are expected to have middle-class incomes (source: Bookings). And businesses are racing to supply what these new customers demand.“ (source: https://www.linkedin.com/feed/update/urn:li:activity:6530736495400087552).
The following chart shows an analysis of the development of global CO2 emissions between 1965 and 2017 (absolute and per capita) based on BP’s „Statistical Review of World Energy“ data. Source of chart: https://wattsupwiththat.com/2018/07/03/bp-data-analysis-global-co2-emissions-1965-2017/.
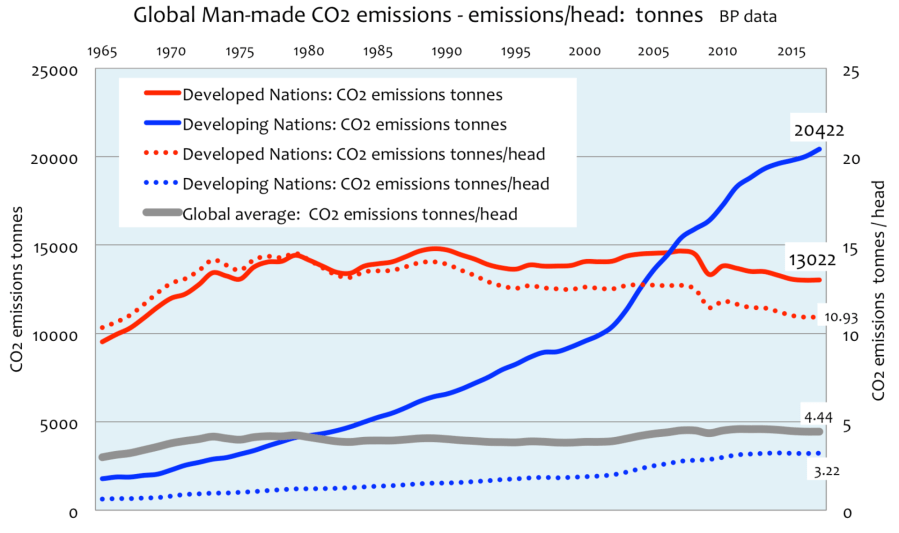
In terms of development of global CO2 emissions, the contrast between the developed and developing worlds remains stark. Developing world emissions overtook developed world CO2 emissions in 2005 and they have been escalating since. Since 1990, CO2 emissions from the developed world have decreased, whereas the developing world has shown a fourfold increase since 1980. CO2 emissions in the developing world are accelerating as the quality of the lives for people in the underdeveloped and developing world improves. At least 1.12 billion people in the developing world still have no access to reliable mains electricity.
Conclusion: It must be clear to anybody, that climate change and global warming cannot be stopped, if the growth of population and wealth in developing and emerging countries comes along with the same level of CO2 and Greenhouse Gas emissions, as it happened in the developed countries in course of the last 200 years since the beginning of the 19th century (more detailed fact&figures on this matter are provided here: https://kubraconsult.blog/2019/05/12/secrets-and-lies-of-the-climate-change/).
END OF EXCURSUS ON POPULATION&WEALTH GROWTH
So, what does this mean for the mobility of the future?
Hypothesis no. 1: Substituting internal combustion engines in individual passenger cars by electric power train has limited benefit for the environment for the time being.
Why? Well, if we were able to substitute immediately the combustion engines in all 1.45 billion motor vehicles, that currently drive around on planet earth, by electric power trains, this would reduce the global CO2 emissions by comparably small 2.6 percent based on the present global electricity mix. According to the „Renewable 2018 Global Status Report“ this global electricity mix consists of 63 percent fossile fuels, 26.5 percent renewable energies and 11 percent nuclear energy. The math how to come to the 2.6 percent CO2 reduction is explained in the following chart.

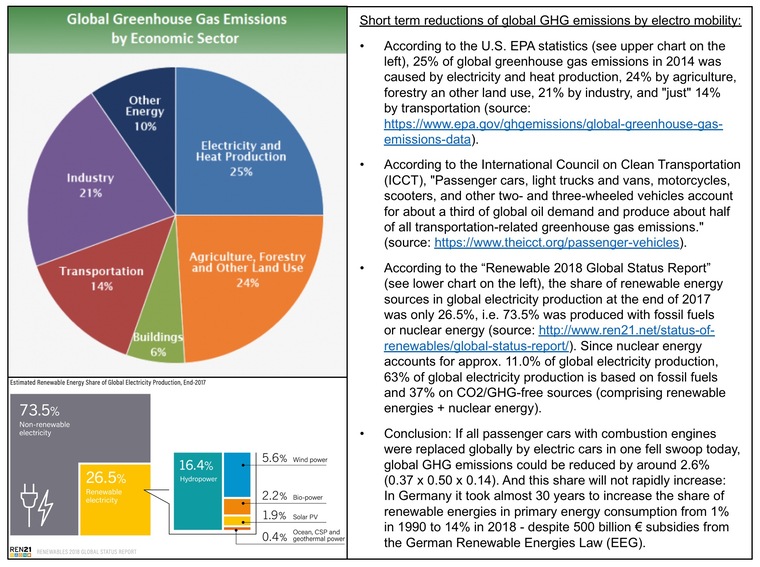
The potential savings will increase over time with the transformation of the global energy mix towards CO2/GHG-free sources to up to 7.8 percent. However, we have to acknowledge that this will be a long and winding road. In Germany, it took almost 30 years to increase the share of renewable energies in primary energy consumption from 1 percent in 1990 to 14 percent in 2018 – despite average subsidies of €20 billion per year from 2000 onwards. And according to climate scientists, were are running out of time in terms of climate change.
Much more important than the short term savings in CO2 emissions, is the resource consumption and the environmental impact caused by production and disposal of individual passenger cars. And in an end-to-end evaluation, we need to consider not only the raw materials and energy, required to build and dispose individual passenger cars and their combustion engines or lithium carbonate- and cobalt-based batteries, but as well the effort for building and maintaining streets, highways, bridges and other transportation infrastructures which are exclusively provided and maintained for motor vehicles.
How many studies and concepts have you seen so far, which follow this holistic approach?
The following chart provides an impression on the magnitude of global automobile production today and in 2050:
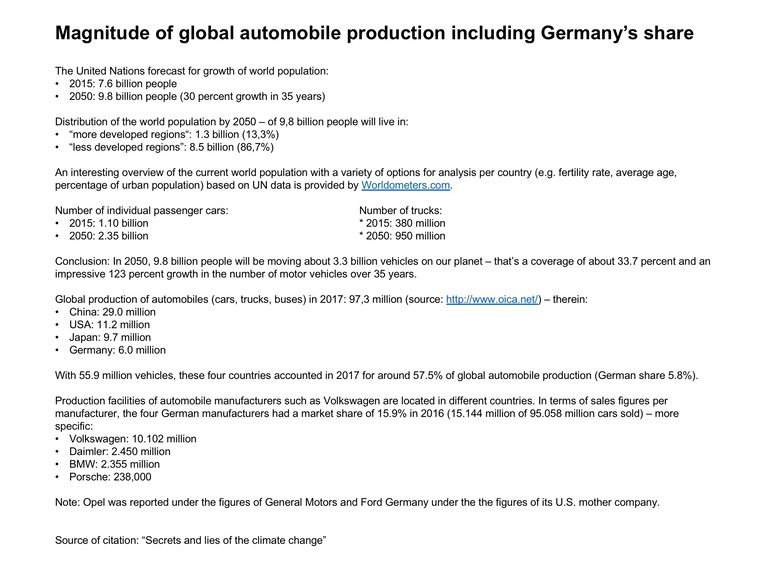

If 9.8 million people in 2050 on planet earth, would really be moving about 3.3 billion vehicles (including 2.35 billion individual passenger cars and 950 million trucks, busses, …), we were dead. This just can’t work. So, we need more intelligent mobility solutions.
Hypothesis no. 2: There will be no „one fits all concept“ that covers all requirements of future mobility globally. Instead, there will be different mobility offerings and technologies which consider the individual needs and circumstances of various countries and societal layers. The future of mobility in Germany will almost certainly look differently than the future mobility in China or Africa.
One important differentiation, we have to make in any case across all countries, is the one between big cities and rural areas. According to the United Nations, more than one half of the world population lives today in urban areas, and virtually all countries of the world are becoming increasingly urbanized. This is a global phenomenon that has nonetheless very different expressions across regions and development levels: richer countries and those of Latin America and the Caribbean have already a large proportion of their population residing in urban areas, whereas Africa and Asia, still mostly rural, will urbanize faster than other regions over the coming decades. These trends are changing the landscape of human settlement, with significant implications for living conditions, the environment and development in different parts of the world (including individual mobility). Source: https://www.un.org/en/development/desa/population/theme/urbanization/index.asp.
The UN Population Division prepares every four years updated estimates and projections of the total and urban population for all countries or areas in the world. Major citations taken from the last UN Population Division report published in 2018 (see: https://esa.un.org/unpd/wup/Publications/Files/WUP2018-KeyFacts.pdf) are:
- Globally, more people live in urban areas than in rural areas, with 55 percent of the world’s population residing in urban areas in 2018. In 1950, 30 percent of the world’s population was urban, and by 2050, 68 percent of the world’s population is projected to be urban.
- Today, the most urbanized regions include Northern America (with 82 percent of its population living in urban areas in 2018), Latin America and the Caribbean (81 percent), Europe (74 percent) and Oceania (68 percent). The level of urbanization in Asia is now approximating 50 percent. In contrast, Africa remains mostly rural, with 43 percent of its population living in urban areas.
- The rural population of the world has grown slowly since 1950 and is expected to reach its peak in a few years. The global rural population is now close to 3.4 billion and is expected to rise slightly and then decline to around 3.1 billion in 2050. Africa and Asia are home to nearly 90 percent of the world’s rural population. India has the largest rural population (893 million), followed by China (578 million).
- The urban population of the world has grown rapidly since 1950, having increased from 751 million to 4.2 billion in 2018. Asia, despite being less urbanized than most other regions today, is home to 54 percent of the world’s urban population, followed by Europe and Africa (13 percent each).
- Growth in the urban population is driven by overall population increase and by the upward shift in the percentage living in urban areas. Together, these two factors are projected to add 2.5 billion to the world’s urban population by 2050, with almost 90 percent of this growth happening in Asia and Africa.
- Just three countries – India, China and Nigeria – together are expected to account for 35 percent of the growth in the world’s urban population between 2018 and 2050. India is projected to add 416 million urban dwellers, China 255 million and Nigeria 189 million.
- Close to half of the world’s urban dwellers reside in settlements with fewer than 500,000 inhabitants, while around one in eight live in 33 megacities with more than 10 million inhabitants. By 2030, the world is projected to have 43 megacities, most of them in developing regions.
- Tokyo is the world’s largest city with an agglomeration of 37 million inhabitants, followed by Delhi with 29 million, Shanghai with 26 million, and Mexico City and São Paulo, each with around 22 million inhabitants. Today, Cairo, Mumbai, Beijing and Dhaka all have close to 20 million inhabitants.
- Some cities have experienced population decline in recent years. Most of these are located in the low-fertility countries of Asia and Europe where overall population sizes are stagnant or declining. Economic contraction and natural disasters have contributed to population losses in some cities as well.
Hypothesis no. 3: Individual passenger car are a dead-end technology – at least for big cities since they do not resolve the issue of traffic-jams and gridlocks. The utilization of CASE (connected, autonomous, shared and electric) mobility concepts is lagging far behind expectations.
Connected Cars, Autonomous Driving and Car Sharing are independently of the power train technology of a car – they work (or don’t work) with ICE (Internal Combustion Engine) cars as well as with EV (Electric Vehicle). Here again, I have to repeat myself: It is a long way to Tipperary to turn these CASE (Connected, Autonomous, Shared and Electric) visions into reality. Waymo, Uber or Tesla can sing a song of the related challenges.
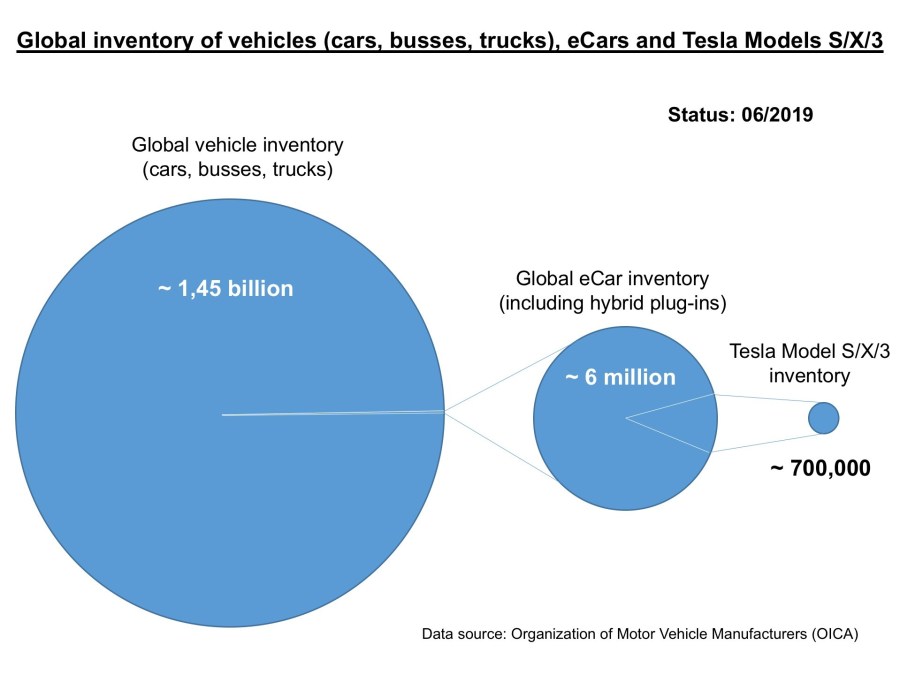
After ten years of intensive promotion and subsidy of electric vehicles by governments, media, environmental activists, U.S. hedge fonds and Chinese protectionists, disappointing 6 million electric vehicles (including hybrid plug-ins) have been sold by June 2019, which represents 0.41% of the present global vehicle inventory:

Are you getting snap breath and want to reply: „But, the growth of electro mobility and Tesla’s growth in particular is «exponential»!!“?
Well, exponential growth is from my point of view, what Apple delivered in the first years after the introduction of the iPhone back in 2007. In the first 8.5 years between mid of 2007 and 2015, Apple sold more than 820 million units. Despite this strong performance, Apple has today a market share of „just“ 23% in a global smartphone market with approx. 3.25 billion users.
Even if the comparison is not totally fair, since smartphones are positioned in a different price range, than electric cars, let’s have a look at the Tesla sales figures: In course of the last 5 years by June 2019, Tesla will have produced&sold approx. 700,000 units (accumulated) of model S, X and 3 (source: https://en.wikipedia.org/wiki/Tesla,_Inc.) including:
- 87,300 in 2015
- 83,900 in 2016
- 101,000 in 2017
- 254,500 in 2018
Fact is, between 2011 and June 2019, electric cars accounted for 0.77% of the global automobile production. Consequently, we are far away from being able to judge whether the growth of electro mobility is „exponential“.
Hypothesis no. 4: Future mobility needs to be designed and developed from the end customer’s point of view – more specific: from „John Doe’s“ point of view, rather than from the „Hippie Yuppie Snowflake Nerd’s“ point of view. And we need positive motivation for John Doe to build up his sense of urgency and mindset for climate-friendly mobility rather than imposing taxes&duties, restrictions&prohibitions and other sorts of bullying on him.
On May 13, 2019, the German Frankfurter Allgemeine Zeitung (FAZ) published an interesting article under the headline „Why Germans don’t like electric mobility“ (unfortunately behind the paywall). The following charts are taken from this FAZ article and are based on a survey performed by the management consultancy Simon-Kucher & Partners. The study is representative of German private customers who have bought or leased a car and drive it regularly (see: https://www.faz.net/aktuell/wirtschaft/auto-verkehr/warum-die-deutschen-elektroautos-nicht-moegen-16173451.html):
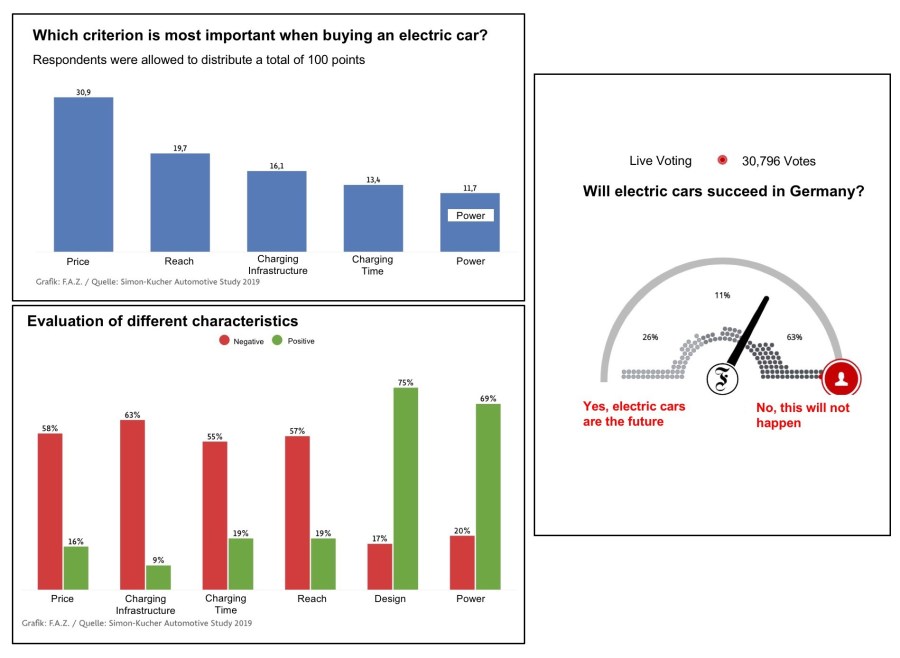

Why should John Doe switch to cars with electric power train as long as they perform significantly worse in terms of price, range and charging times than cars with combustion engines? Volkswagen CEO Herbert Diess recently made it clear that due to the high cost of the battery it is difficult or even impossible to offer electric cars at low entry prices, and even Elon Musk’s dream of a USD 35,000 entry-level model has suddenly shattered.
Even the hope, that electric vehicles with large batteries will become cheaper over time due to scaling effects, is questionable. The German Manager Magazin published on February 1, 2019, an article under the headline „Hydrogen cars at the price of a gasoline engine“: https://www.manager-magazin.de/unternehmen/autoindustrie/wasserstoffauto-toyotas-plaene-mit-der-brennstoffzelle-a-1251106.html (automatic English translation: https://t1p.de/ebrn).
Citation: „Prof. Katsuhiko Hirose has been working on Toyota’s fuel cell project for 16 years (the company has been researching the subject for much longer) and says: „The fuel cell has very high economies of scale in front of it, while the battery is already quite at the end of its scale. 70% of battery costs are in the raw materials, which do not become cheaper when demand rises.“
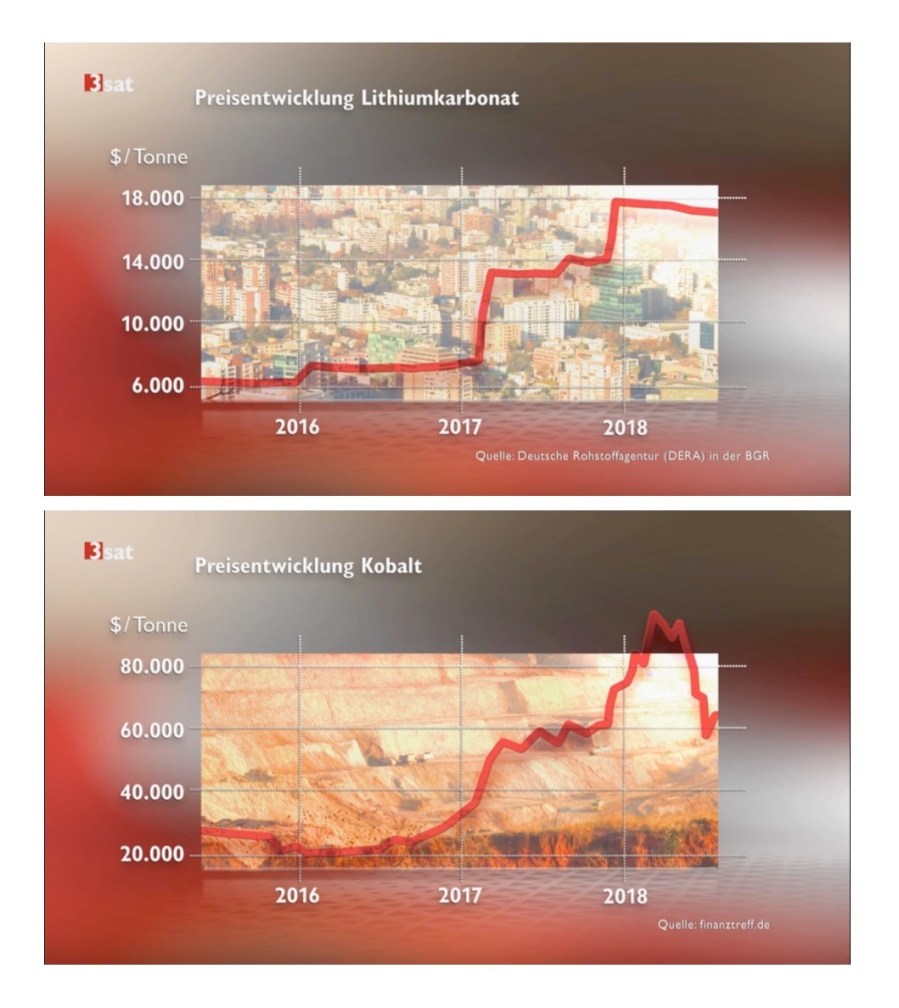
The following chart shows the price development of lithium carbonate and cobalt on the world market from 2016 to 2018. Chile is the world market leader for the production of lithium carbonate. The Republic of Congo accounts for almost two thirds of world cobalt production. China is trying to get the lithium&cobalt value chains under its control. As the chart illustrate, the increasing demand for lithium carbonate&cobalt lead to increasing prices for both raw materials.

The attached overview with key data on mobility in Germany 2016/2017 dates from 2018 and is therefore not quite up to date; at least the magnitudes of the data should still be correct. According to the German Federal Environment Agency, the utilization rate of public transport in Germany is therefore around 10%.
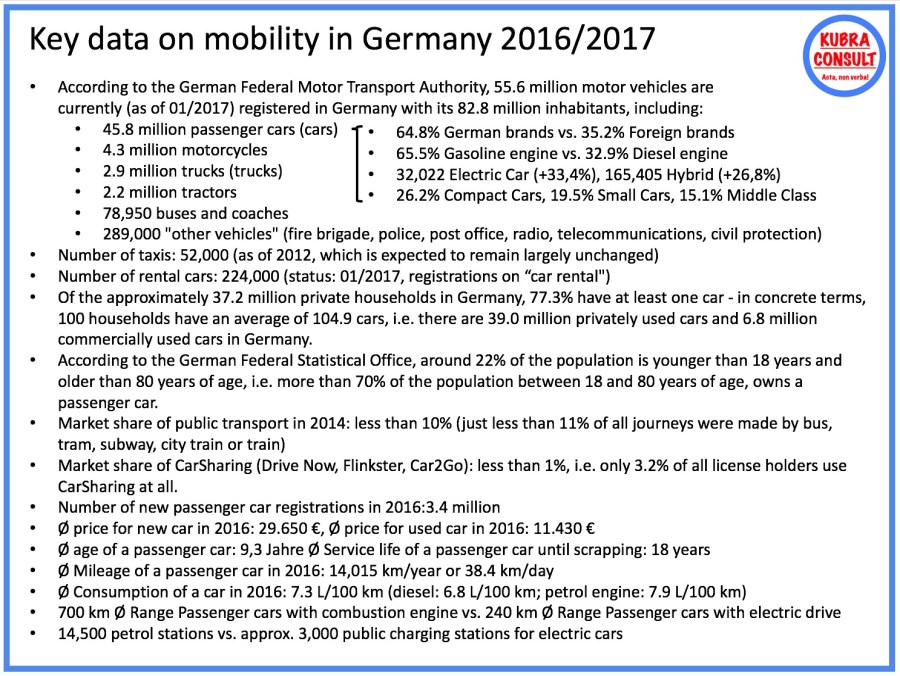
According to the German Federal Motor Transport Authority, 255,851 vehicles were registered for car rental as at 01.01.2019 – in relation to 47.1 million passenger cars in Germany or 57.3 million motor vehicles (including buses and trucks) and just under 7.5 million car trailers (see: https://www.kba.de/DE/Statistik/Fahrzeuge/Bestand/b_jahresbilanz.html ).
There are only about 55,000 taxis in Germany and the number of car pools is significantly lower than the number of individual drivers. In 2012, 90% of cars in Germany were driven by individual drivers. The ratio of passengers to drivers is about 1:13.
Conclusion: A persuasive mobility concept of the future doesn’t need subsidies or any other form of statutory enforcement. It will be used, because it has been developed from the customer’s point of view and delivers obvious value add to the customers. We need positive motivation rather than additional taxes&duties, restrictions&prohibitions and other sorts of bullying, which are counterproductive if we want to sharpen John Doe’s sense of urgency for climate-friendly mobility and develop a positive attitude for this ambition.
Hypothesis no. 5: We need to think big in terms of future mobility concepts and we need to leave particularly the paradigm behind us that individual mobility can only be based on individual passenger cars, that are owned by individual human beings and that drive on conventional traffic infrastructure comprising roads, highways, bridges or petrol stations.
The financial requirement for the maintenance of road, rail and waterways in Germany is €13 billion per year plus €2.7 billion per year from the backlog demand for the renovation of dilapidated buildings such as bridges, tunnels and locks. The demand alone for the maintenance of 680,000 kilometers of roads in Germany is estimated at €11.5 billion per year.
The related expenditure of natural resources is also enormous. In recent years, 120 million tons of mineral building materials have flowed into the German road network of motorways, federal, rural, county and municipal roads each year, of which 100 million tons have been used to maintain existing stocks and 20 million tons to add new ones (source: https://www.wiwo.de/technologie/green/erhalt-von-strassen-und-co-unterschaetzter-rohstofffresser/13550972.html).
Imagine if this effort could be saved through new, innovative mobility concepts and the funds freed up could be used for other, more meaningful purposes. Following the same logic, it doesn’t make any sense, to change every 5 years the mobility infrastructure of a country, since resources (including taxpayers money) are limited and should be only be invested in long term sustainable solutions with benefit for the public.
Powerful, comfortable and cost-effective public transport systems could be one mosaic stone of future mobility as well as bicycles, e-scooters and other two-wheel vehicles, which consume less resources, less space and exhaust less CO2 emissions.
Even the famous „Flight taxis“ (eVTOL jets = electric vertical take-off and landing jets), as offered by Lilium, Volocopter or Airbus (Vahana) could be a complementary mosaic stone with game changing qualities in this context (see „Flying instead of driving: Why electric cars are not the best solution“: https://kubraconsult.blog/2017/11/18/flying-instead-of-driving-electric-cars-are-not-the-best-solution/ (German version: https://kubraconsult.blog/2017/11/18/fliegen-statt-fahren-elektroautos-sind-nicht-die-beste-loesung/).
eVTOL jets with electric propulsion, autonomous control and the possibility of exchanging power storage units have a number of interesting advantages:
- eVTOL jets offer their users a spectacular travel and flight experience with a panoramic view from above onto the overflying terrain.
- eVTOL jets are not tied to conventional transport infrastructure (roads, bridges, motorways, petrol stations) and can simply „fly around“ obstacles.
- eVTOL jets enable very short travel times by using the direct connection between two locations and high travel speeds
- eVTOL jets can take off and land almost anywhere, e. g. on skyscrapers, meadows, mountains or islands.
- eVTOL jets cover regional mobility requirements with a range of 300 kilometers
- eVTOL jets are 100% emission-free and have a low noise level
- Thanks to their simple design, eVTOL jets have low production and operating costs – no need for expensive landing gear (such as electric cars) or complex gearboxes.
- eVTOL jets with interchangeable power storage devices eliminate the need to build a costly energy distribution infrastructure from energy source to end user.
- eVTOL jets help to drastically reduce the cost of maintaining conventional transport infrastructure
- eVTOL jets open up completely new possibilities for structuring the work-life balance, as employees no longer have to live near their workplace.
Conclusion: Intelligent mobility and IT concepts may bring us for example in a position where people are not forced any more to move from rural areas to big cities for economic reasons – since they can either work from home or since they can be enabled to travel from their rural home to their urban office quickly and without traffic jams.
We need to systematically investigate and evaluate the impact of disruptive future mobility concepts on economic and societal structure, which partially have been established and in place for centuries.
Hypothesis no. 6: The mobility of the future has to consider various social aspects, which go beyond moving a human being from A to B: Affordable mobility means personal freedom and limitation of personal freedom affects primarily socially weaker people.
Personally, I have tried almost all forms of mobility, which are available in Germany: Own car, rental car, car sharing, bus, tram, subway, suburban train, train, plane, motorcycle, bicycle, walking, …
Two years ago I sold my own car because it was just standing around in the garage and I hardly needed it. Although I live centrally in Munich and have good transport connections right in front of the house, I notice that my social contacts have noticeably decreased after the sale of the car.
Opportunity makes thieves, as the saying goes. And obviously the fact that I no longer have easy access to an exclusive vehicle, which I can use at any time to quickly and easily drive 15 kilometers to visit friends, or to travel the 550 kilometers to Northern Hesse to visit my sister, has a negative effect on my social life.
These kind of side effects should not be underestimated. In particular socially disadvantaged (poor) people, the elderly, the disabled or people with limited mobility should not be disadvantaged by future mobility concepts. I still remember the feeling of freedom that my first motorcycle gave me when I was 16 years old living in a small town in Northern Hesse, where the bus went only once per hour to the bigger neighbor town (and not at all at night after visiting the discotheque).
The same category includes the question of what should happen to the millions of employees who today produce individual passenger cars in the large manufacturing sites of automobile companies when new, disruptive mobility concepts become established on the market. In Germany alone, 1.8 million jobs and a large proportion of prosperity depend directly or indirectly on the automotive industry.
Hypothesis no. 7: CASE (connected, autonomous, shared and electric) mobility concepts do not solely come along with advantages, but can also be misused to affect a citizen’s security or privacy.
It’s important to acknowledge that CASE (connected, autonomous, shared and electric) mobility concepts do not solely come along with advantages. In times in which the privacy of respectable citizens is restricted by government surveillance, e.g. in the USA or China, connected cars and autonomous driving represent an additional threat potential, since these technologies allow to make a citizen’s private life even more transparent and controllable for the government.
By 2021, at least 50% of global GDP will be digitized, with growth in every industry driven by digitally enhanced offerings, operations, and relationships (Source: IDC FutureScape: Worldwide IT Industry 2018 Predictions from October 2017).
The growth of all data generated and exchanged worldwide remains high – even more so, the rate is even accelerating according to a joint study published on November 27, 2018, by the U.S. hard disk manufacturer Seagate and the IT market research company IDC (see: https://www.seagate.com/gb/en/our-story/data-age-2025/ and https://www.seagate.com/files/www-content/our-story/trends/files/idc-seagate-dataage-whitepaper.pdf).
According to the IDC study, global data traffic is expected to grow to from 33 Zettabytes in 2018 to 175 Zettabytes by 2025 (1 Zettabyte = 1.000.000.000.000.000.000.000). For classification: If this amount of data was stored on conventional DVDs, the stack of data carriers would exceed the distance between Earth and Moon 23 times. In the comparable forecast of the previous year, however, market researchers „only“ expected 163 Zettabyte for 2025.
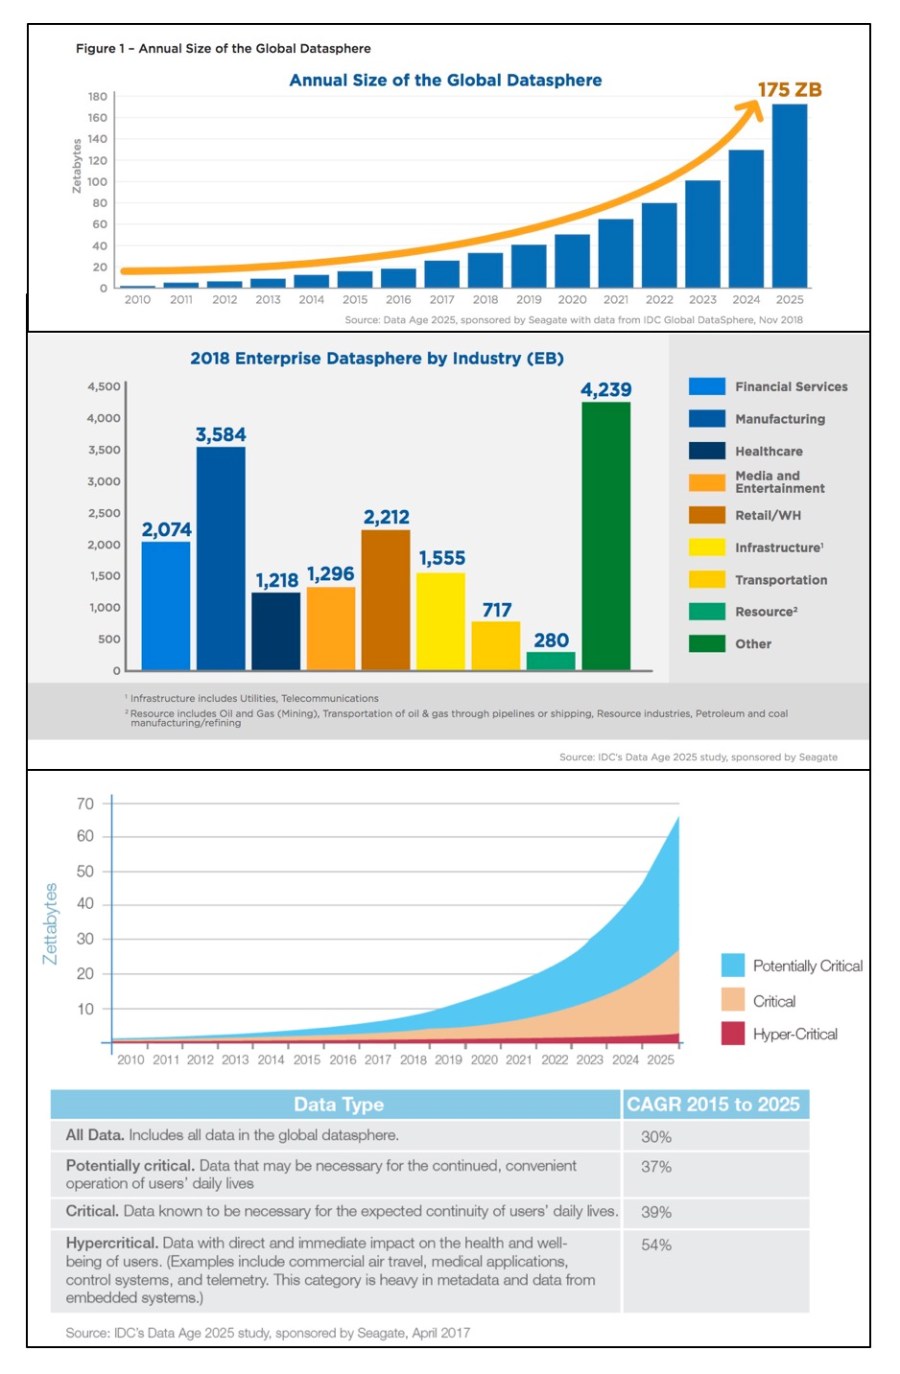
The following citation from the IDC study could also be taken from George Orwell’s „1984“: „The data-driven world will be always on, always tracking, always monitoring, always listening and always watching – because it will be always learning“.
Unfortunately, this surveillance logic applies as well for CASE (connected, autonomous, shared and electric) mobility concepts. Similar to smartphones, CASE vehicles are packed full of sensors: cameras, sonar, radar, LIDAR system or GPS and they depend on a network. In addition to their actual functional purpose, sensors and network can also be misused to monitor and control the users of CASE vehicles.
Autonomous vehicles’ data is growing even faster than the global data sphere thanks to autonomous test vehicles, which generate between 5TB and 20TB of data per day and vehicle. All this data must be received, stored, protected, analyzed in real-time – and retained for research and legal information.
Cameras tend to generate 20 to 60Mbps, depending on the quality of the images that are captured, as well as sonar (10 to 100kbps) radar (10kbps), LIDAR systems (10 to 70Mbps) and GPS (50kbps). The key is to ensure that sensors are collecting the right data and it is processed immediately, stored securely and transferred to other technologies in the chain.“
I do not want to go into this topic more in detail, since this blog is already quite comprehensive and the logic is pretty similar to surveillance via smartphones. If you are interested, you will find further information in the following three blogs:
- „George Orwell’s 1984 was a warning and not an instruction manual“ published on January 13, 2020, in German language: https://kubraconsult.blog/2020/01/13/george-orwells-1984-war-eine-warnung-und-keine-bedienungsanleitung/ (automatic translation into English with Google translator: https://t1p.de/ulx5)
- „How the U.S. government discredits the U.S. American IT industry“ you can learn in my blog of the same name published on August 20, 2017: https://kubraconsult.blog/2017/08/20/how-the-us-government-discredits-the-us-american-it-industry/ (German version: https://kubraconsult.blog/2017/03/08/wie-die-us-regierung-das-internet-diskreditiert/).
- Why Smartphones are an ideal tool to spy on you, your family&friends and your colleagues is explained in my blog „The spy in your pocket“ published on April 25, 2017: https://kubraconsult.blog/2017/04/25/thy-spy-in-your-pocket/ (German version: https://kubraconsult.blog/2017/04/25/der-spion-in-ihrer-tasche/).
Hypothesis no. 8: It’s never smart to put all eggs into one basket by further increasing the dependency of industrial countries on electricity. Experience shows that risk sharing is usually smarter than to rely on a system with cluster risks. Murphy’s law applies and the financial industry sends kind regards.
Finally, we need to acknowledge that modern industrial societies are already highly dependent on electricity. When people think of the power going out the first things that usually come to mind are TV, computer and internet. A typical response is „I can read a book, play board games, it would not bother me too much.“
However, it’s much more complex. Many homes are all electric, so as soon at the lights are out they have no heat, no air condition, no hot water and you can’t cook. Your refrigerator and freezer no longer work, so that frozen and perishable foods become bad after a short time. Cities run on electricity. Elevators, traffic systems, water supply systems, cash machines, electronic point of sales systems in stores do not work, if the power is out.
Some well-prepared people who live in areas where there are frequent power outages have generators. However, most generators run on diesel fuel or gasoline. If the power is out, gas stations can’t pump gas. Once generators run out of gas, those people will be in the dark too. If you have a battery-operated radio, you might be able to get some news for a while, but if the grid goes down you probably won’t be able to get a station.
If you have a landline phone, it might work, but your cordless phone won’t. If you don’t have an old-fashioned phone to plug into the wall you’re out of luck. And, while your cell phone will not go out immediately, the circuits will soon be overloaded with panicked callers, service will get more and more spotty, until the central switching facility finally runs out of power backup, and it goes completely dead.
That power blackouts are not an unrealistic threat is illustrated by the following anecdote. End of May 2019 a power blackout threatened Switzerland. On the morning of May 20, 2019, it became suddenly narrow around 8:00 o’clock. A large part of the Swiss electricity production flowed to Germany at this time – contrary to the European grid forecasts, which did not foresee such a deficit in German production. Without the immediate help from Switzerland, the network in Germany would have collapsed.
An explanation why this dangerous situation occurred can be found in the Energy Charts of the Fraunhofer Institute for Solar Energy (ISE), which show the German electricity system in real time. On the respective Monday morning, a precarious situation arose in Germany because too little solar and wind power flowed into the grid (marked by the red arrow in the attached lower chart). Not even the start-up of all available fossil power plants was enough to cover the entire consumption. Why the Swiss of all people and not other neighbors had to help out in this emergency situation cannot be answered with the available data. The Swiss grid company Swissgrid is investigating the incident.

Source: https://www.c-c-netzwerk.ch/index.php/c-c-n-blog/beinahe-blackout (automatic English translation see: https://t1p.de/582g).
The design of energy supply and energy distribution needs to consider future developments in an decentralized network of energy suppliers and energy consumers , than can cause unpredictable peak loads, e.g. even resulting from desirable technological developments. Anything is connected to anything.
Harald Lesch is a 58-year-old German professor of physics who is quite popular in Germany. He moderates scientific tv shows, teaches at the Ludwig Maximilian University in Munich and sympathizes with the Fridays for Future movement.
On June 5, 2019, Lesch and his team published at YouTube a video in German language under the headline „Fuel cell in the car: Better than lithium batteries?“, which can be watched here: https://lnkd.in/dG4ZbKk.
The chargers for electric car batteries, that are today in the market have a comparably low capacity and therefore long charging times (depending on the capacity of the electric car battery), e.g.:
- 3.0 kW chargers with a charging time of 10 to 12 hours
- 7.4 kW chargers with a charging time of 3 to 4 hours
- 22 kW chargers with a charging time of 1 to 2 hours
- 50 kW charges with a charging time of 30 minutes
For the video, Lesch and his team took the assumption that in the mid to long term future 350 kW chargers for electric cars will prevail to make electricity charging as convenient and short as filling up gas. Lesch argues, that in this future scenario, if one million people in Germany simultaneously wanted to charge their e-cars with 350 kW high performance chargers, 350 gigawatts of power would have to be provided by the German power grid. Currently, unfortunately, the entire German power grid delivers an average output of just 68.5 gigawatts.
You may argue, that this example is constructed and not realistic and that in the future more electricity from renewable energy sources will be available. All fair points. However, the German power grid is a complex animal: It is more than 1.7 million kilometers long (well above 1 million miles), it’s distance spans 4.67 times the distance from the earth to the moon, or 45 times around the equator of the earth. Just for one small country like Germany. And it needs 566,300 substations to be serviceable.
Decentralized renewable energy sources reduce the stability of the already complex power grid and increase its vulnerability – not only due to fluctuating electricity capacities depending on the intensity of wind and sun, but also since the decentralized sources open up additional entry points for hackers and other nasty creatures. From the distance it seems, that nobody really has thought trough in an holistic and systematical approach, how future supply and demand can affect the stability of the German power grid. It becomes even more complex, if we look beyond the German borders and discuss energy demand and supply on a EU level.
Against this background, the question must be allowed whether it’s smart to put all eggs into one basket by transforming individual mobility on electricity and thereby further increasing the dependency of industrial countries on electricity. Experience shows that risk sharing is usually smarter than to rely on a system with cluster risks. Murphy’s law applies and the financial industry sends kind regards.
Of course, there are similar dependencies in motor vehicles with combustion engines. Most of the world’s oil reserves are located in countries such as Saudi Arabia, Iraq, Iran, Libya, Venezuela or Russia. In addition, the business model that automotive and oil companies have jointly built and developed over decades is extremely lucrative, as can be seen from the billions in profits of these companies.
Although I am not a supporter of conspiracy theories, I would like to recommend the movie „Who killed the electric car“ to you on this subject: https://vimeo.com/210171457.
„Who Killed the Electric Car?“ is a 2006 documentary movie that explores the creation, limited commercialization, and subsequent destruction of the battery electric vehicle in the United States, specifically the General Motors EV1 of the mid-1990s. The movie explores the roles of automobile manufacturers, the oil industry, the federal government of the United States, the California government, batteries, hydrogen vehicles, and consumers in limiting the development and adoption of this technology.
I can’t judge to what extent the narrative of the movie is actually based on facts or where the facts end and the fiction begins. Regardless of this, the movie gives an impression of the different, sometimes contradictory interests of the various stakeholders in a multi-billion dollar market.
Conclusion
The design of future mobility concepts needs to be based on the analysis of global mega trends, such as urbanization, growing awareness for ecology, aging of society in developed countries, or the rapidly increasing population and wealth in developing and emerging countries as mission critical lever. With regard to the future of mobility, we need to consider the global impact of mobility offerings&technologies over their entire lifecycle including sourcing, production, utilization and disposal. In addition, the perspective must go far beyond technology and include economic, environmental, societal impact (including side-effects e.g. on socially weak and disadvantaged people) as well as security and privacy. Each mobility concept requires a certain infrastructure, which needs to be build up and maintained (gas or charging stations, roads, highways, bridges, tunnels, parking space, railway lines, train or subway stations etc. pp.). The one time and ongoing cost for this infrastructure must be included into the evaluation. The energy supply for the future mobility concepts (electricity, oil, hydrogen) must be considered (reliability, affordability) including the impact of future technological developments (e.g. high-performance 370 kW chargers). A persuasive mobility concept of the future doesn’t need subsidies or any other form of statutory enforcement. It will be used, because it has been developed from the customer’s point of view and delivers obvious value add to the customers. We need positive motivation rather than additional taxes&duties, restrictions&prohibitions and other sorts of bullying, which are counterproductive if we want to sharpen John Doe’s sense of urgency for climate-friendly mobility and develop a positive attitude for this ambition.
I am sure that there are other aspects that need to be taken into account when designing the mobility of the future. Nevertheless, I hope that I have been able to give you at least some valuable food for thought in this blog and make clear, that the future of mobility goes far beyond a discussing the matter of individual passenger cars with electric power train versus individual passenger cars with combustion engines.
Complementary readings are provided in the following blogs:
- A comprehensive introduction into „Digital business models and Platform Economy“ is provided in my blog published on November 4, 2017: https://kubraconsult.blog/2017/11/04/digital-business-models-and-platform-economy/ (German version: https://kubraconsult.blog/2017/09/06/digitale-geschaeftsmodelle-und-plattformoekonomie/).
- The socio-economic consequences of Digitalization are described in my blog of the same name published on March 17, 2017: https://kubraconsult.blog/2017/03/17/the-socio-economic-consequences-of-digitalization/ (German version: https://kubraconsult.blog/2017/03/14/die-soziooekonomischen-folgen-der-digitalisierung/).
- The major elements of a „Digitalization strategy for countries (using Germany as an example)“ are provided in my blog of the same name published on February 21, 2018: https://kubraconsult.blog/2018/02/21/digitalization-strategy-for-countries-using-germany-as-an-example/ (German version: https://kubraconsult.blog/2018/02/17/digitalisierungsstrategie-fuer-deutschland/).
- Thoughts on the basics of change are provided in my blog of the same name published on August 28, 2018: https://kubraconsult.blog/2018/08/28/basic-prerequisites-for-effective-change/ (this blog is so far only available in English language)

10 Kommentare zu „The future of mobility goes far beyond electric power train versus combustion engine“