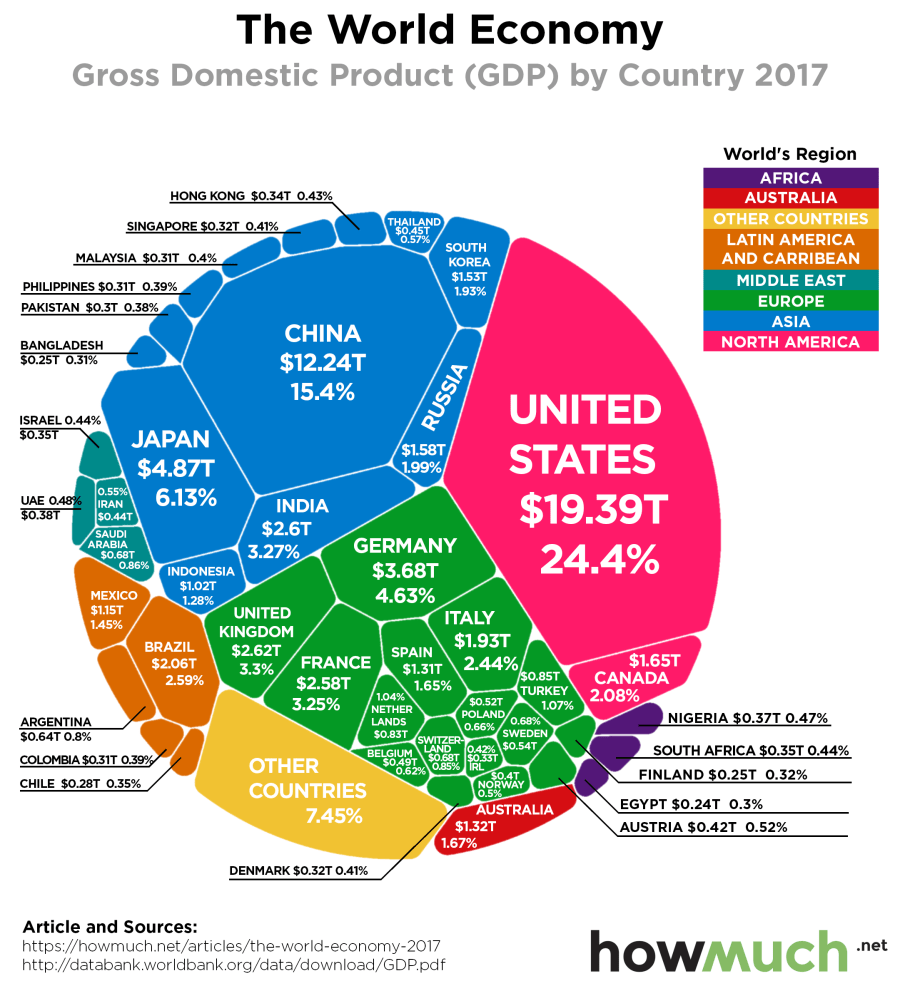
Germany is the 4th largest global economy with a GDP of US$4,000 billion behind the USA with US$20,494 billion, China with US$13,407 billion and Japan with US$4,972 billion. Together these four economies contributed in 2018 slightly more than 50% to the global Gross Domestic Product (US$42,873 billion vs. US$84,740 billion) based on data provided by the International Monetary Fund (IMF) – source: https://en.wikipedia.org/wiki/List_of_countries_by_GDP_(nominal).
The following chart illustrates the shares in global economic output (GDP) on the basis of figures from 2017 (source: https://howmuch.net/articles/the-world-economy-2017):
According to provisional figures from the German Federal Statistical Office, Germany exported in 2018 goods worth €1,318 billion and imported goods worth €1,090 billion in return (in relation to a GDP of €3,390 billion) – never before has the value of German exports and imports been higher.
However, Germany has not been the global „export world champion“ for 10 years. In 2008, Germany was still able to defend this unofficial title against China – six times in a row, Germany exported more goods than any other country. As of 2009, however, Germany was clearly replaced by China. According to the United Nations Conference on Trade and Development (UNCTAD), China was able to increase its lead over Germany to around US$815 billion in 2017 (export volume of US$2.260 billion for China vs. US$1.45 billion for Germany). In addition, the USA was again ahead of Germany in the years 2010 to 2017.
Regardless of this shift, Germany is heavily criticized for its foreign trade surpluses – among others by the EU Commission, the Organization for Economic Cooperation and Development (OECD), the International Monetary Fund (IMF) and the US government. As with any controversial discussion, it is important in the debate about the German trade surplus to know the essential facts and figures, which I have compiled from some accurate sources below. In addition, I will provide you in the second half of this blog with some ideas why Germany is a comparably successful export nation, who benefits from the German export strength and what Germany needs to do to continue its success story in the future.
Before we go into the facts and figures, we need to clarify some basics.
Excursus on „Balance of Payment“, „Capital Account Balance“, „Current Account Balance“ and „Trade Account Balance“
If you already know the difference between these four terms, you can skip this excursus and continue with the subsequent facts and figures on German foreign trade.
Most of exports and imports involve finance i.e. receipts and payments in money. An account of all receipts and payments is termed as Balance of Payments (BOP). According to the renowned U.S. economist and economic historian Charles P. Kindleberger, „The Balance of Payments of a country is a systematic record of all economic transactions between the residents of the reporting country and residents of foreign countries during a given period of time“.
The Balance of Payment record is maintained in a standard double-entry book-keeping method. International transactions enter into the record as credit or debit. The payments received from foreign countries enter as credit and payments made to other countries as debit. Balance of Payment is a record pertaining to a period of time; usually it is all annual statement. All the transactions entering the balance of payments can be grouped under three broad accounts: (1) Trade Account Balance, (2) Current Account Balance, (3) Capital Account Balance, and (4) Official International Reserve Account comprising changes in Foreign Exchange balances. However, it can be vertically divided into many categories as per the requirement.

Note: The so called „investment income“ or „primary incomes“ comprise interests, profits and dividends received/accrued from transnational investments, whereas the so called „unilateral receipts/payments“ or „secondary incomes“ comprise money transfers with no identifiable considerations, e.g. migrant’s remittances to their home countries or payments to international organizations.
Comprehensible explanations on the pillars of the Balance of Payment are provided here (English language): https://kalyan-city.blogspot.com/2010/12/concept-definition-and-structure-of.html or here (German language): https://www.bundesbank.de/de/service/schule-und-bildung/schuelerbuch-geld-und-geldpolitik-digital/die-leistungsbilanz-614150#tar-3.
The most important pillar in the German Current Account Balance is trade in goods with exports in 2018 of €1.318 billion and imports of €1.090 billion. By comparison, services, primary income and secondary income (often referred to as „invisible benefit transactions“) have a much lower weight in the German Current Account Balance and Balance of Payments. That’s the reason, why I will focus in this blog primarily on the German Trade Account Balance.
However, as the following example shows for the United States of America, a country can have at the same time a Trade Account Balance deficit and a Current Account Balance surplus.
The following chart is taken from a presentation held by the President of the Kiel Institute for the World Economy (ifw Kiel), Gabriel Felbermayr, at an event of the think tank „Agenda Austria“ on September 19, 2018, in German language under the headline „Globalization under the microscope“: https://youtu.be/WU_Tx7d31Tw or https://www.agenda-austria.at/europa-usa-trump-handelskonflikt/.

In his presentation, Gabriel Felbermayr explains the Trade and Current Account Balances of the USA with its most important trading partners for the year 2017. The USA trade deficit with the European Union (EU) of US$153 billion was more than offset in 2017 by USA surpluses in services (plus US$51 billion), primary income (plus US$106 billion) and secondary income (plus US$10 billion), so that the USA, even had a slight current account surplus of US$14 billion with the EU.
The USA Current Account Balance deficit of minus US$466 billion in 2017 is mainly the result of trade with China (minus US$358 billion), Mexico (minus US$86 billion) and Japan (minus US$80 billion).
Germany accounts for a significant share of trade between the EU28 and the Eurozone on the one hand and the USA on the other hand. The following chart is taken from an article published on August 8, 2018, in German language under the headline „Export surpluses: Germany will not change its dominance“: https://www.welt.de/wirtschaft/article180839366/Leistungsbilanz-Wo-Deutschland-nachbessern-muss-und-wo-Trump-falsch-rechnet.html.
In the chart, Germany’s share of the current account deficit of the USA with the EU28 and the Eurozone is shown separately:

The following chart illustrates the development of the USA’s Current Account Balance with the European Union between 2003 and 2017. The chart is also taken from Gabriel Felbermayer’s presentation at the „Agenda Austria“ event on September 19, 2018:

In 2017, the US trade with the EU28 generated a Trade Account Balance deficit (goods) of US$153 billion, while services and primary incomes generated an annually growing surplus of combined US$159 billion in 2017. The growing surplus over the 14-year period between 2003 and 2017 is mainly influenced by the dominance of US platform enterprises (e.g. Google, Apple, Facebook, Amazon, Microsoft) and US IT companies that offer transnational cloud services as well as by the rise of China and the growing impact of globalization on world trade streams.
An interesting study published by the OECD in March 2019 under the headline „Trade in the digital era“ is provided here: https://www.oecd.org/going-digital/trade-in-the-digital-era.pdf. Citation: „Digitalization is reducing the cost of engaging in international trade, connecting businesses and consumers globally, helping diffuse ideas and technologies, and facilitating the coordination of global value chains (GVCs). Today, more small parcels and lower-value digital services (applications) are being traded internationally; more services are becoming tradable; and goods and services are increasingly bundled in ‘smart’ products. These changes are bringing new challenges, going beyond managing digital disruption to ensuring that the opportunities and benefits from digital trade are realized and shared more inclusively.“
A comprehensive introduction into „Digital business models and platform economy“ is provided in my blog of the same name published on November 4, 2017: https://kubraconsult.blog/2017/11/04/digital-business-models-and-platform-economy/ (German version: https://kubraconsult.blog/2017/09/06/digitale-geschaeftsmodelle-und-plattformoekonomie/).
End of Excursus
After having understood the differences between „Balance of Payment“, „Capital Account Balance“, „Current Account Balance“ and „Trade Account Balance“ let’s now continue with the German foreign trade, which is dominated by the trade in goods, as already mentioned, with exports in 2018 of €1.318 billion and imports of €1.090 billion.
Note: An interactive visualization provided by the EU Statistics Agency „Eurostat“ shows the top 5 trading partners for the import and export of goods for each of the 28 EU states: https://ec.europa.eu/eurostat/news/themes-in-the-spotlight/trade-in-goods-2018.
German Export, Import and Export Surplus in 2018
According to provisional figures from the Federal Statistical Office, Germany exported goods worth €1,318 billion in 2018 (2017: €1,279.07 billion, 2016: €1,207.0 billion, 2015: €1,194.0 billion) and in return imported goods worth €1,090 billion (2017: €1,034.32 billion, 2016: €954.6 billion, 2015: €949 billion) – never before has the value of German exports and imports been higher. Overall, the export and import of goods increased by 5.4% and 4.9% respectively annually between 1980 and 2018. As a result of the crisis, imports fell by 17.5% from 2008 to 2009.
In all years since 1952 more goods have been exported from Germany than imported. In the fifteen years from 2004 to 2018, the Trade Account Balance surplus was fourteen times more than €150 billion. And also in 2009 the Trade Account Balance was positive (€138.7 billion) despite the global financial and economic crisis and Germany’s high dependency on exports. According to the German Federal Statistical Office, the highest trade balance surplus to date was achieved in 2016 with €248.9 billion. The second and third highest surpluses were recorded in 2017 and 2015 (2017: €247.9 billion, 2015: €244.3 billion), while the fourth highest trade balance surplus to date, €227.9 billion, was recorded in 2018.
The following chart illustrates the development of German Export, Import and Export surplus in absolute figures between 1995 and 2018 (source: https://www.bpb.de/nachschlagen/zahlen-und-fakten/globalisierung/52842/aussenhandel):

By the way, the last chart above shows that the German export surplus does not result solely from a disproportionately high export of goods, but from a constant divergence of goods exports and goods imports, since the slope of the curve for goods exports is higher than the slope for goods imports (as always, temporary exceptions confirm the rule).
Development of German Foreign Trade Ratio
Germany’s foreign trade ratio (percentage of a country’s gross domestic product accounted for by exports and imports of goods) was 87.2% in 2018 (2017: 86.5%, 2016: 84.0 %, 2015: 85.7%). The time series of the development of the German foreign trade ratio between 1991 and 2018 is illustrated in the following chart provided by the German Federal Statistical Office (source: https://www.destatis.de/DE/Themen/Wirtschaft/Globalisierungsindikatoren/aussenwirtschaft.html):

Every year, the German Federal Statistical Office publishes the main facts and figures on German foreign trade under the title „German Foreign Trade – Export and Import in the Context of Globalization“. The publication also contains historical data and facts. The most recent version was published in April 2019 in German language and can be downloaded here: https://www.destatis.de/DE/Themen/Wirtschaft/Aussenhandel/Publikationen/Downloads-Aussenhandel/zusammenfassende-uebersichten-monat-2070100191044.pdf.
Germany’s major trading partners (export/import) in 2018
According to the German Federal Statistical Office, Germany’s ten most important trading partners for exports are primarily neighboring countries and the United Kingdom, as well as the United States of America and the People’s Republic of China outside Europe. In 2018, the top 10 most important trading partners each accounted for almost 60% of German exports of goods (€780 billion of €1,300 billion) and almost 60% of German imports of goods (€632 billion of €1,090 billion). If the circle of trading partners is expanded to the 25 countries with the highest trading volume, these already cover more than 80% of German exports and imports.

Germany’s export along world regions in 2018
In the discussion about Germany’s Trade Account Balance surpluses, the Euro (which is from the German point of view undervalued by 25 to 30%) is repeatedly cited as a key argument – among other things – to claim that Germany’s export successes are achieved at the expenses of other Eurozone member countries.
As the following chart illustrates, Germany exports just around 37% of its total export volume to the Eurozone (€492.54 billion of €1,317.93 billion).

The statistics, entitled „Volume of exports from Germany by country group in 2018“ (source: https://de.statista.com/statistik/daten/studie/158303/umfrage/deutsche-exporte-und-importe-2010-nach-laendergruppen/), shows how the €1,317.93 billion of exports from Germany are distributed across the continents and within Europe between the Eurozone and the non-Eurozone states, namely (the percentages in brackets refer to the €1,317.93 billion of export volume in each case):
- €900.22 billion (= 68%) to Europe – thereof €778.64 billion € (= 59%) in EU states and 121.58 billion € (= 9%) in non-EU states
- €492.54 billion (= 37%) in EU countries belonging to the Eurozone vs. €286.1 billion (= 22%) in EU countries not belonging to the Eurozone
- €219.8 billion (= 17%) to Asia vs. €159.13 billion (= 12%) to America vs. €22.64 billion (< 2%) to Africa vs. €12.3 billion (< 1%) to Australia&Oceania
Trade Account Balances between Germany and its trading partners as of 2015
In terms of the country-specific Trade Account Balances between Germany and its trading partners, I can provide you in the following chart unfortunately only with an older statistics from 2015. The German trading partners with the highest positive and negative Trade Account Balances in 2015 were:

German exports/imports along product groups in 2018
In 2018, exports of the 5 largest product groups (motor vehicles and their parts, machinery, chemical products and computers, electronic and optical products and electrical equipment) accounted for approx. 57% of total German exports in value terms (€745 billion of €1,318 billion). The 10 largest product groups (including pharmaceuticals and related products and other transport equipment, metals, food and animal feed and rubber and plastic goods) covered in 2018 almost 80% of all German exports (€1,046 billion of €1,318 billion).
The following chart illustrates the top 10 of the most important product groups for German exports in 2018 (source: https://www.destatis.de/DE/Themen/Wirtschaft/Aussenhandel/handelswaren-jahr.html):

In 2018, imports of the 5 largest product groups (Electronic data processing including consumer electronics, motor vehicles, chemical products, machinery, crude oil and natural gas) accounted for approx. 44% of total German imports in value terms (€474.7 billion of €1,090 billion). The 10 largest product groups (including electrical equipment, metals, pharmaceutical products, food and animal feed and others vehicles) covered in 2018 almost 68% of all German exports (€736.3 billion of €1,090 billion). Source of data: https://www.capital.de/wirtschaft-politik/das-sind-deutschland-wichtigste-importgueter.
- Electronic data processing including consumer electronics: €117.4 billion
- Motor vehicles: €116.9 billion
- Chemical products: €88.2 billion
- Machinery: €86.6 billion
- Crude oil and natural gas: €65.6 billion
- Electrical equipment: €63.8 billion
- Metals: €61.0 billion
- Pharmaceutical products: €57.5 billion
- Food and animal feed: €45.8 billion
- Other vehicles: €33.5 billion
According to the breakdown by Main Industrial Groupings (MIG), which allows goods traded to be allocated according to their use, German foreign trade is dominated by capital goods and intermediate goods. This applies to both exports and imports. In the case of exports, the two aforementioned groups of goods account for approx. three-quarters of the total value (capital goods: approx. 45%, intermediate goods: approx. 30%), and in the case of imports for approx. 60% (capital goods: approx. 30%, intermediate goods: approx. 30%).
German exports along enterprise sizes and legal forms in 2017
In 2017 there were in total 3,481,860 companies – therein 9,706 larger corporations with 250 and more employees in Germany. Corporations include, for example, the GmbH (limited liability company) and the AG (stock corporation). Other legal forms include partnerships (e.g. OHG, KG) or individual entrepreneurs. The latter were the most common legal form in 2017 with a number of around 2.15 million. In the same year, there were a total of around 3.48 million companies in Germany.

In North Rhine-Westphalia, the most populous federal state, most companies are located in Germany. This is followed by the two southern states of Bavaria and Baden-Wuerttemberg. The smallest number of companies is in Saarland and the city state of Bremen.
Most of the 3,481,860 companies were recently established in the retail sector. This was followed by companies in the fields of freelance, scientific and technical services, construction and hospitality. The sector with the highest turnover was manufacturing, followed by trade and energy supply. Source: https://de.statista.com/statistik/daten/studie/237346/umfrage/unternehmen-in-deutschland-nach-rechtsform-und-anzahl-der-beschaeftigten/.
The corporate structure in German foreign trade shows that the largest companies account for the lion’s share of foreign trade turnover. Companies with an annual turnover of over €100 million generate around two thirds of the total value in exports (approx. 1,300 companies), while 1,120 companies in this category are responsible for around 60% of all imports in imports.
Due to the unequal distribution of the company structure, all companies with less significance for the overall result – i.e. 90% of the companies – can be exempted from their statistical reporting obligation for foreign trade within the EU (intra trade). The total number of enterprises active in imports, at 720,000, is about twice as high as the number active in exports.
Why is Germany a comparably successful export nation?
As largest economy in the European Union, Germany has (with almost 23% in 2017) a comparably strong share of manufacturing in the country’s gross value added – versus approx. 10.3% in the UK as 2nd largest economy in the EU, approx. 11.4% in France as 3rd largest economy in the EU, approx. 16.4% in Italy as 4th largest economy in the EU and approx. 14.4% in Spain as 5th largest economy in the EU.
According to a recent article published by the German Federal Agency for Civic Education on April 30, 2019, every fourth job in Germany depends on exports (source: https://www.bpb.de/nachschlagen/zahlen-und-fakten/globalisierung/52842/aussenhandel).
Germany, the UK, France, Italy and Spain as top 5 countries contributed in 2017 together more than 70% to the EU’s Gross Domestic Product (GDP).

German companies are particularly good in mass production of capital goods. They produce motor vehicles, machinery, electrical engineering, or chemical and pharmaceutical products which are required both in developed countries as well as in developing and emerging countries. The companies of the famos German „Mittelstand“ constantly manage to work their way up to world market leader positions with innovative development and high quality products, machines, systems and plants.
Germany was certainly one of the biggest profiteers from the rise of China and other emerging countries in course of the last 30 years.
The Euro, which is undervalued by 25% to 30% from a German perspective at the current level of 1.13 US$ per €, means that German companies are able to offer their high quality products on the world market at a significantly lower price than it was possible with the Deutschmark until 1998. Unfortunately, the Euro is much less beneficial (if not even harmful) for German consumers, savers, tenants and taxpayers – so it would not be correct to claim, that Germany benefits at the bottom line from the Euro. This topic is so complex and multilayered that I would like to refer you to my separate blog „The life lies of the Euro“ published on July 26, 2018, where you find a comprehensive evaluation of the most important aspects: https://kubraconsult.blog/2018/07/24/the-life-lies-of-the-euro/ (German version published on July 8, 2018, see: https://kubraconsult.blog/2018/07/09/die-lebensluegen-des-euro/).
Germany is supposed to be a rich country – which is true from a macro economic perspective, when you consider magnitude of GDP (4th biggest global economy), GDP growth, tax revenues, public debt or unemployment rates. However, if you take the effort to look behind the curtain, you will find a lot of room for improvement, such as long term wage dumping to the detriment of lower income groups in particular, the 2nd high taxes&duties burden for singles in full-time-jobs of 35 OECD countries behind Belgium, the highest electricity costs in the European Union, a low home ownership ratio (Germany is a country of tenants. While two out of three French and even three out of four Spaniards live in their own four walls, in Germany it is not even one in two), a low shareholder ratio of around 16% and so on.
50% of the Germans are „have-nots“. According to Credit Suisse’s Global Wealth Data Book, in 2016 Germany ranked 117th out of 172 countries in the inequality of wealth distribution with a so-called „Gini-coefficient“ of 0.79 (0 = total equal distribution of money, 1 = one household owns everything, the rest nothing). 22 out of 28 EU member states have a less uneven distribution of wealth than Germany, which is at the level of Togo and Morocco. And the inequality in Germany is growing: in 2013, the Gini-coefficient in Germany was still around 0.77. Note: At 0.29, the Gini-coefficient for income distribution in Germany is much more balanced.
Again, this is a very complex and multilayered topic, so that I would like to refer you to my separate blog „Unequal land and its consequences“ published on May 11, 2018, where you find a lot of insights on the real situation of German citizens: https://kubraconsult.blog/2018/05/11/unequal-land-and-its-consequences/ (German version published on May 8, 2018, see: https://kubraconsult.blog/2018/05/08/ungleichland-und-seine-folgen/).
There are certainly other influencing factors, such as infrastructure, level of education, legal certainty etc. pp., which positively affect the German export performance, however, I am confident, that the big levers are adequately reflected above.
Who benefits from German export strength?
Some thoughts on the question, who benefits from the German export strength. The most obvious candidates are:
- The owners/shareholders of the exporting enterprises via profits, dividends and rising stock prices and market capitalizations of their corporations.
- The German state, which generates high and continuously rising tax revenues and is in a position to refinance its public debt on the capital market at favorable terms thanks to solid public finances.
- The working people in Germany e.g. through secure jobs and decreasing unemployment rates.
1. Owners/shareholders of German enterprises
The shareholder structure of DAX companies has changed significantly since the amendment of the German Corporate Income Tax Act, which came into force in 2002 and introduced a tax exemption for the sale of shareholdings in companies. In the past, control of companies by majority shareholders or several major shareholders was typical in Germany. These major shareholders were often other German companies, which is why the term „Deutschland AG“ also came to be used to describe a system of corporate control that was closed to foreign investors.
Today, the majority of „Deutschland AG“ is held by foreign investors. North American investors currently hold more than a third of the shares in the 30 DAX companies – which means that their value has increased since 2016, as a recent study by the German Investor Relations Association (DIRK) shows. The share of German investors in the local stock market, on the other hand, has fallen: While it was 17.1% in 2016, the figure fell to 15.3% in 2018, as the following Statista chart shows (source: https://www.stern.de/wirtschaft/wem-gehoert-der-dax–nicht-den-deutschen–8767664.html):

Ernst&Young has published in April 2018 an excellent study under the headline „Who owns the DAX?“ based on data from 2017 (source: https://www.ey.com/Publication/vwLUAssets/ey-wem-gehoert-der-dax/$FILE/ey-wem-gehoert-der-dax.pdf). According to this study, the majority of DAX shares were held by so-called institutional investors, which include pension and investment funds, insurance companies and banks. In 2017, they held an average of 63% of all shares in DAX companies. Private investors, on the other hand, only account for an average of 11.0% of the investors in DAX companies. 12% of all shares are held by investor families and foundations. The largest institutional investor in the DAX in 2017 was again the BlackRock investor group followed by the Vanguard investor group. Blackrock holds an interest in 27 of the 30 DAX-listed companies (as of April 30, 2019). In more than half of them even with more than 5% (source: https://de.statista.com/statistik/daten/studie/518085/umfrage/groesste-blackrock-beteiligungen-am-aktienkapital-von-dax-unternehmen/ and https://www.finanzen.net/nachricht/aktien/die-34-heimliche-weltmacht-34-blackrock-stockt-in-deutschland-auf-in-diese-dax-unternehmen-investiert-der-schwarze-fels-6807426). At the end of 2017, more than eight out of ten shares (82%) of a DAX group were in free float on average, only around 18% in fixed ownership.
The German shareholder ratio is around 16% overall, lagging miles behind by international standards. In total, around 10.3 million of 83.0 million German citizens own shares or equity funds. There is about one in six citizens and corresponds to 16.2% of Germans older than 14 years. This figure includes not only direct equity investments, but any form of investment in which equities play a role in any way. The figure also means that around 84% of Germans have no shares in their portfolio despite the long zero-interest phase. The interest in equity and equity fund investments has noticeably strengthened in recent years and the number of shareholders has reached its highest level since 2007, however the shareholder ratio in the USA, Switzerland or the Scandinavian countries, for example, is more than twice as high as in Germany, which is a tragedy for German wealth management. Sources: https://www.gevestor.de/news/aktionaersquote-in-deutschland-ein-trauerspiel-835209.html and https://www.dai.de/de/das-bieten-wir/studien-und-statistiken/statistiken.html.
2. The German state
Between 2002 and 2018, the annual tax revenues of the German state as a whole (comprising the German Federal Government, federal states as Bavaria or Saxonia and municipalities) rose by €334.63 billion. The nominal increase of 66.31% (€776.26 billion in 2018 vs. €441.63 billion in 2003) contrasts with a loss of purchasing power of 17.5%, i.e. both nominal and inflation-adjusted tax revenues of the state as a whole rose sharply.
Adjusted for inflation, we are talking about a whopping €270 billion additional tax revenues – per year (!).
The following charts illustrate the development of German tax revenues between 2002 and 2017 (upper left chart), the lower government spending for refinancing public debt due to low key interest rates in the Eurozone (upper right chart), the cross-comparison of the taxes&duties burden amongst the 35 OECD countries in 2017 (lower left chart) and the interest rate losses and savings of private households due to low key interest rates in the Eurozone between 2010 and 2017.

3. Working people in Germany
Now comes the annoying part of the whole story. The following charts provided by the German Institute for Economic Research (DIW Berlin) illustrate the long-term development of average disposable household incomes by decile in Germany between 1991 and 2015 (upper chart) and the comparison of the Gini-coefficient of need-weighted disposable household income in the OECD in 2007 vs. 2014:

As you can see in the upper chart above, the real income of the two lower deciles in 2015 was below the baseline of 1991 – which is sobering for the working people, while it is good for the German corporates. As the attached chart taken from a TAZ article published on June 17, 2017, illustrates German corporates were able to improve their competitiveness amongst the Eurozone countries because their unit labor costs increased much more slowly than in almost all other Eurozone countries (source: https://taz.de/Deutsche-Exportueberschuesse/!5417971/):

As unit labor costs are influenced by the evolution of wages and labor productivity, I would like to round off this paragraph with a chart from the Jacques-Delors-Institute Berlin illustrating the development of real labor productivity and real labor compensation in Germany, France Italy and Spain between 1999 and 2017.

The development of labor unit cost (mainly affected by real income increases and productivity increases) is the third rather complex and multilayered topic and I would like to refer you again to two of my separate blogs, which have both been published in June 2017:
- Automatic English translation of „Real wage developments in the EU between 2001 and 2016“: https://t1p.de/j3fg (original German version see: https://tivot.blog/2018/02/10/reallohnentwicklung-in-der-eu-zwischen-2001-und-2016/)
- Automatic English translation of „Corporate profits vs. real wages in Germany between 1991 and 2016“: https://t1p.de/adiz (original German version see: https://tivot.blog/2018/02/10/unternehmensgewinne-vs-reallohne-in-deutschland-zwischen-1991-und-2016/).
Conclusion:
Based on the definitions of „Balance of Payment“, „Capital Account Balance“, „Current Account Balance“ and „Trade Account Balance“, you have gained some insights in the magnitude and structure of German Export, Import and Export Surplus in 2018 including:
- Development of German Foreign Trade Ratio
- Germany’s major trading partners (export/import) in 2018
- Germany’s export along world regions in 2018
- Trade Account Balances between Germany and its trading partners as of 2015
- German exports/imports along product groups in 2018
- German exports along enterprise sizes and legal forms in 2017
Following these facts and figures, I provided you with major reasons why Germany is a comparably successful export nation and who benefits from the German export strength.
As the largest economy in the EU and the Eurozone, Germany’s economic development has a significant impact on the development of other EU and Eurozone economies. If Germany gets a cold, the EU and Eurozone get a flu.
Germany’s dependency on exports (significantly influenced by long-term wage dumping and a Euro exchange rate that is 25 to 30% too low from the German point of view) is not healthy.
Germany must invest significantly more in its infrastructure, in education and in its ability to innovate (particularly with regard to digital business models and platform economy, artificial intelligence or quantum computing). In addition, opportunities must be created to let the working population participate in value enhancement of productive assets (e.g. through a state fund à la Norway or Singapore). Germans are very conservative about their wealth creation and retirement provision, which means that both the shareholder ratio and the home ownership ratio are among the lowest in the EU.
In addition, the wealth inequality in supposedly rich Germany is too high (Gini-coefficient of 0.79), which increases the risk that the 50% of „have-nots“ will at some point turn to politically extreme parties.
I would like to end with a final reference to my blog „Digitalization strategy for countries (using Germany as an example)“, which was published on February 21, 2018: https://kubraconsult.blog/2018/02/21/digitalization-strategy-for-countries-using-germany-as-an-example/ (German version: https://kubraconsult.blog/2018/02/17/digitalisierungsstrategie-fuer-deutschland/).

Thank you for sharing the charts and definitions in particular.
The question how to take influence on German politics – beyond ridiculous elections – remains open…